4 hours chart shows 05:00 as the candle time.
Created at 09 Jul 2020, 16:54

KO
4 hours chart shows 05:00 as the candle time.
09 Jul 2020, 16:54
Hi!
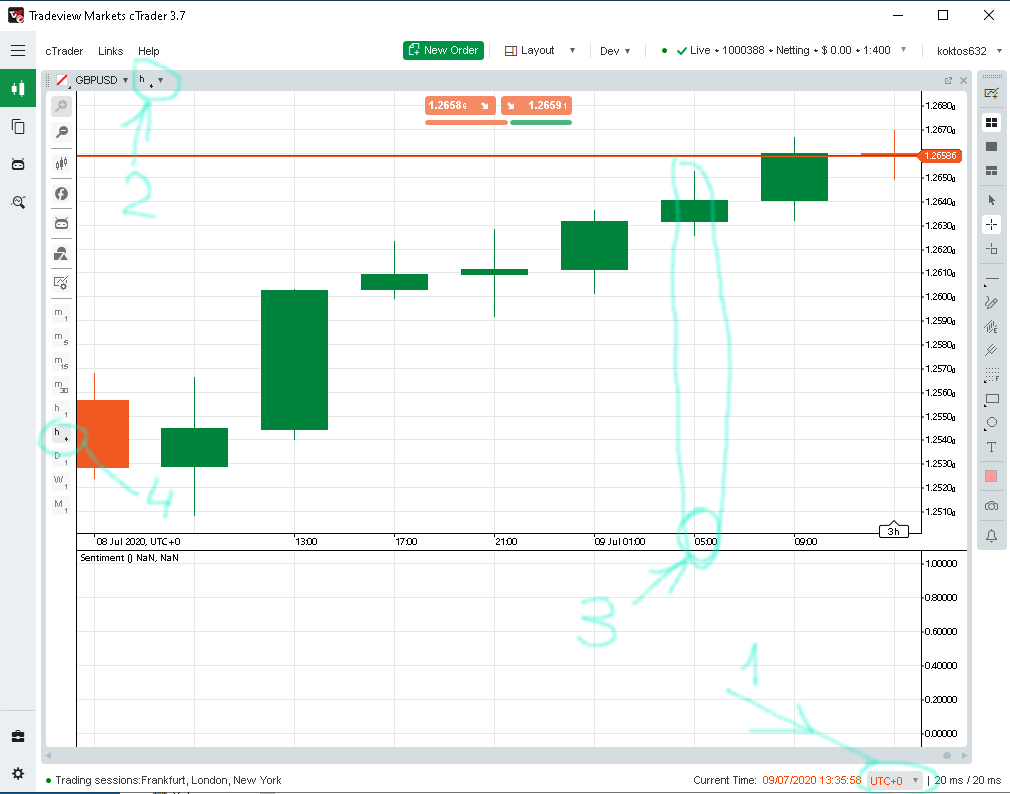
The time zone is UTC (1)
The time frame is 4h (2 and 4)
What does 05:00 (see 3) mean on the chart?
I am expecting to see 04:00 or 08:00 here.
How to know what the time zone is used to calculate 4 hours candles?
How to know what the time zone is used to calculate 1 day candles?
Clarify, please.
PanagiotisCharalampous
10 Jul 2020, 08:31
Hi koktos632,
The reference point is the market's opening time, which is Sunday 21:00. For that time and on you should see a candle every four hours (21:00, 01:00, 05:00 etc).
Best Regards,
Panagiotis
Join us on Telegram
@PanagiotisCharalampous