BUG: Same trend lines, horizontal lines being displayed in DIFFERENT charts

BUG: Same trend lines, horizontal lines being displayed in DIFFERENT charts
22 Sep 2019, 08:24
I'm using FxPro cTrader and I analyze around 10 symbols. The analysis include creating trend lines, horizontal lines and fibonnaci. However, when changing from one symbol to another, often times the trend lines from previous symbols are also drawn in a new symbol, completely messing things up. Moreover, if I delete the trend lines from the new symbol (to try to clean things up), the chart which the trend lines were originally drawn is also deleted.
Over the years I've used countless charting apps and this never happened. cTrader team, please take a look at this as this is a basic functionality of the application.
Thank you.
Replies
benpepperwhittaker
23 Sep 2019, 15:43
RE:
Panagiotis Charalampous said:
Hi ctid1551761,
Thanks for posting in our forum. This behavior is by design. If you need a clean chart for a new symbol, just open a new chart.
Best Regards,
Panagiotis
What do you mean "just open a new chart"?
I have a workspace with 3 charts and want to be able to switch between symbols easily. This is not possible, so I must have one symbol per workspace and switch between workspaces. Is this the best way for me to do it?
(Now I posted another thread because there's a bug which makes this functonality too a mess for me.)
@benpepperwhittaker
PanagiotisCharalampous
23 Sep 2019, 15:51
Hi Ben,
By design objects that are drawn on a chart, they are kept if you change a symbol. Therefore if you need to have a clean chart for a new symbol, you need to open a new chart.
Best Regards,
Panagiotis
@PanagiotisCharalampous
benpepperwhittaker
23 Sep 2019, 16:16
RE:
Panagiotis Charalampous said:
Hi Ben,
By design objects that are drawn on a chart, they are kept if you change a symbol. Therefore if you need to have a clean chart for a new symbol, you need to open a new chart.
Best Regards,
Panagiotis
Yes, so if I understand you corretly, you do not support multichart analasys on several symbols? I just don't see the logic personally. You have the tech to see multiple charts on the same symbol, and switch between symbols with all charts changing to the new symbol at the same time. But the drawings stay on, which ruins the whole point, as far as I can see.
@benpepperwhittaker
ctid1551761
23 Sep 2019, 16:22
RE:
This is simply bizzare and totally unexpected. It's counter intuitive and no charting package at all works like that.
Panagiotis Charalampous said:
Hi Ben,
By design objects that are drawn on a chart, they are kept if you change a symbol. Therefore if you need to have a clean chart for a new symbol, you need to open a new chart.
Best Regards,
Panagiotis
@ctid1551761
benpepperwhittaker
23 Sep 2019, 18:06
RE: RE:
ctid1551761 said:
This is simply bizzare and totally unexpected. It's counter intuitive and no charting package at all works like that.
Panagiotis Charalampous said:
Hi Ben,
By design objects that are drawn on a chart, they are kept if you change a symbol. Therefore if you need to have a clean chart for a new symbol, you need to open a new chart.
Best Regards,
Panagiotis
This is how I feel about it too, but I think Panagiotis feels this is the best way. I really cannot understand it. I have asked about this before too but got the same answer. :)
@benpepperwhittaker
PanagiotisCharalampous
24 Sep 2019, 08:18
Hi to both,
We have plans to introduce a more comprehensive way of managing chart objects in future versions. At the moment, we are considering appropriate solutions.
Best Regards,
Panagiotis
@PanagiotisCharalampous
dreampunchboy
24 Oct 2019, 12:31
( Updated at: 21 Dec 2023, 09:21 )
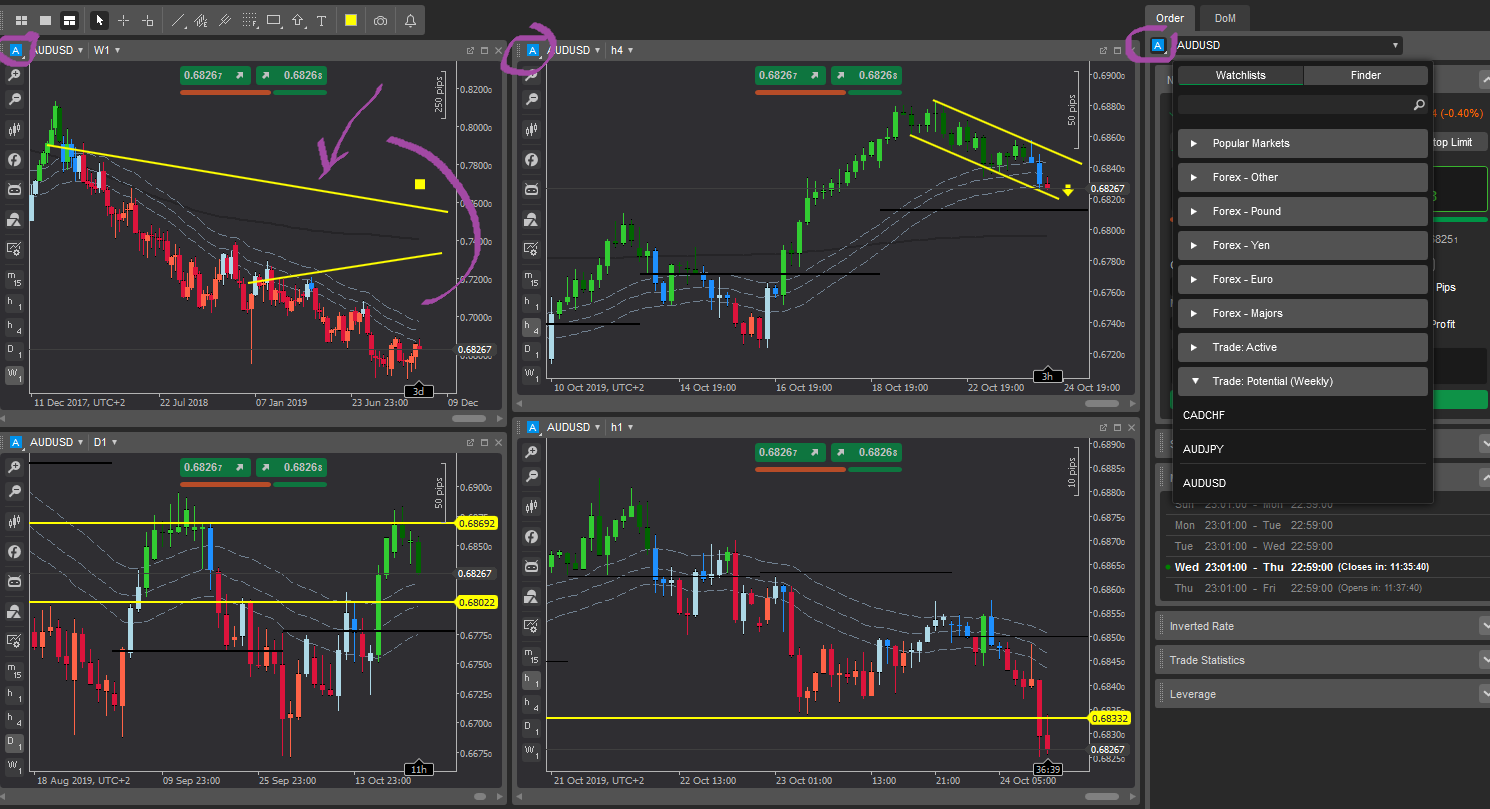
This really does not make sense, especially with the concept of tagging a chart.
Please see below. On the right side I've setup all the currency pairs I'm analysing and tagged all the charts with "A".
Thus I can run through the symbols and the charts in different time frames can update as part of my analysis.
You can see on the top left that trendline should clearly not be there.
So this is counter productive with "tagging" of charts and frankly renders the "tagging" useless.
The only other alternative I can think of is to setup 20 different Work Spaces, one for every symbol but I don't think that's practical and would be very slow to go through.
Can we please get a more detailed indication of the future plans or when this will be. @Panagiotis if possible please provide details.
@dreampunchboy
byfamous
13 Jan 2020, 11:44
RE:
PanagiotisCharalampous said:
Hi to both,
We have plans to introduce a more comprehensive way of managing chart objects in future versions. At the moment, we are considering appropriate solutions.
Best Regards,
Panagiotis
Hi Panagiotis,
As I am in agreeance with this thread and have started looking at other charting options.
Can you provide an ETA on when you will introduce a more comprehensive way of managing charts objects?
@byfamous
PanagiotisCharalampous
13 Jan 2020, 11:55
Hi byfamous,
We plan to introduce it in v3.8 but we do not have an ETA yet.
Best Regards,
Panagiotis
@PanagiotisCharalampous
PanagiotisCharalampous
23 Sep 2019, 08:54
Hi ctid1551761,
Thanks for posting in our forum. This behavior is by design. If you need a clean chart for a new symbol, just open a new chart.
Best Regards,
Panagiotis
@PanagiotisCharalampous