Anchoring text to trendlines or hozisontal lines
03 Jul 2019, 18:31
Hi!
I would like to be able to anchor text to the lines that I put on my chart, så that when I zoom in/out and switch between timeframes, I can see when kind of level it is that I have marked, such as the Daily open, Weekly open, highs, lows etc.
Is this possible?
Replies
benpepperwhittaker
04 Jul 2019, 14:12
( Updated at: 21 Dec 2023, 09:21 )
There's many reasons why not.
Firstly I would then have to constantly move the text boxes from left to right and back when switching between timeframes.
Secondly it is very much unnecessary work and hard to manage, to have all the text boxes lined up over/under each other. It will definately look very messy.
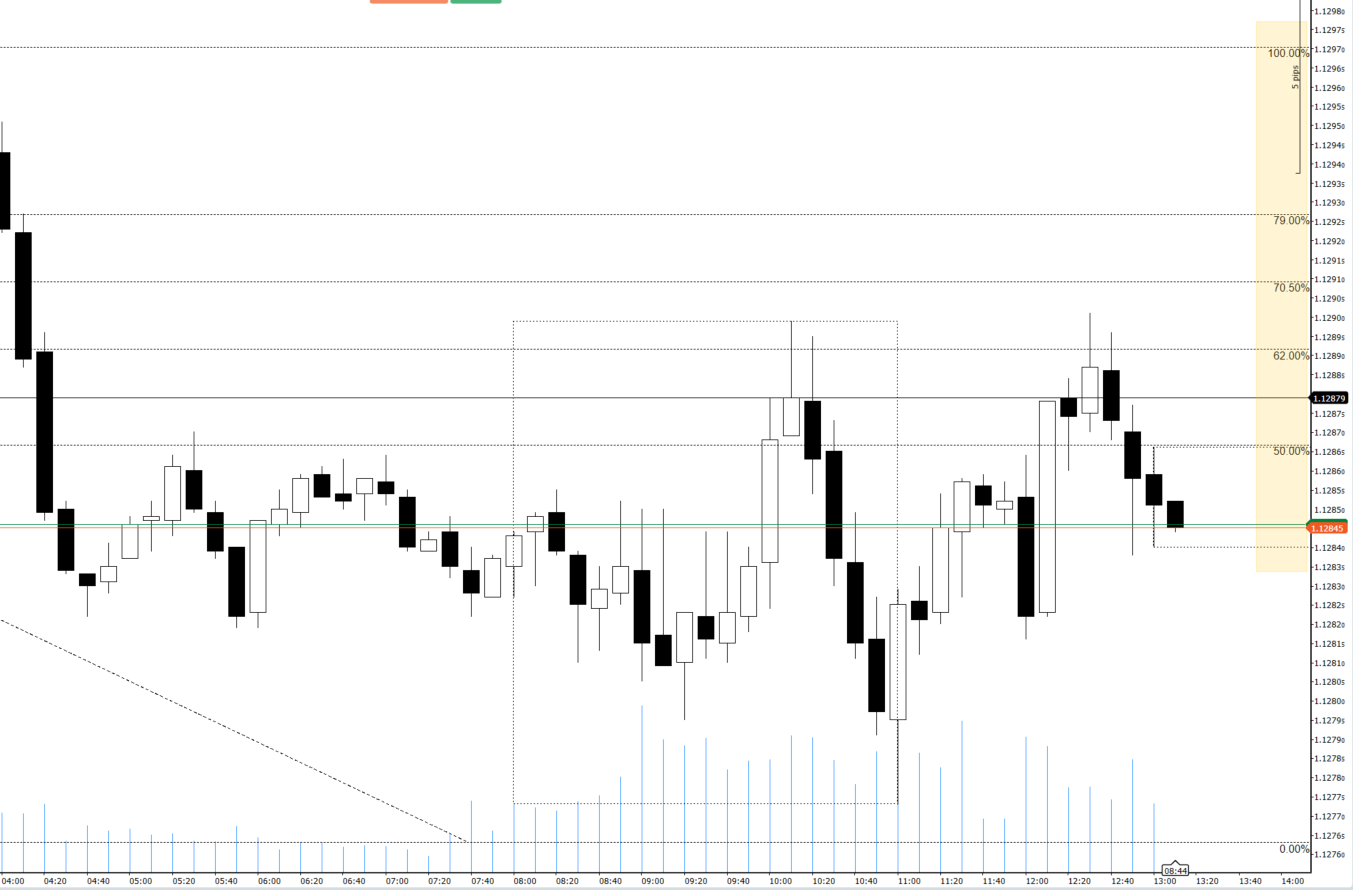
I'd like them to be like the numbers on the fibonacci tool, so that no matter how you zoom in and out, you'll see the numbers to the right on your chart like this:

I assume though, by your respons, that this is not something that's coming to your platform in the near future.
Ben
@benpepperwhittaker

PanagiotisCharalampous
04 Jul 2019, 09:25
Hi benpepperwhittaker,
Why don't you just use the Text tool. The test should stay at the same position relative to the line if you zoom in/zoom out from the chart.
Best Regards,
Panagiotis
@PanagiotisCharalampous