Trendline not accurate when switching between timeframes

Trendline not accurate when switching between timeframes
02 Jul 2019, 00:17
Hi!
I use trendlines to mark out different stuff, for example the weekly high. The thing is: when I make the trendline start from the weekly high on a weekly chart and I drop down to an H4 chart for example, the trendline isn't accurately originating from the H4 high of the candle. It starts beyond that.
Not a very big problem, just irritating and make the chart cluttered.
Is there a way to change this?
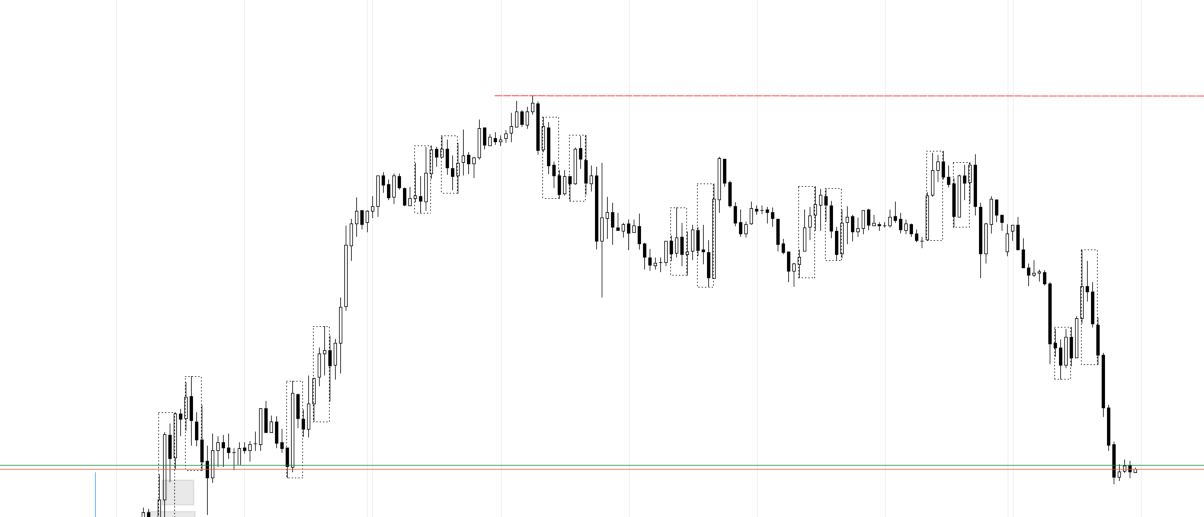
Example:
Replies
benpepperwhittaker
02 Jul 2019, 10:45
( Updated at: 21 Dec 2023, 09:21 )
RE:
Panagiotis Charalampous said:
Hi benpepperwhittaker,
From the screenshot ir is not clear what is the problem. Could you please send us two screenshots, one for W1 and one for H4 showing the difference you are writng about?
Best Regards,
Panagiotis
Here is two pictures:
I draw the trendline from the candle high on the Daily chart:

Here is what i looks like on the Hourly chart: I want the trendline to start from the high of the candle on the hourly chart as well, where I have drawn an arrow, to avoid stuff looking messy when there are several trendlines on the chart. This has not been a problem at the platform I used before so I would assume it's possible to do something about.

Thanks!
@benpepperwhittaker
PanagiotisCharalampous
02 Jul 2019, 12:28
Hi benpepperwhittaker,
That is not possible because of the nature of the candlestick charts. The highs and lows are not plotted on the exact time the highs and lows happen but on the opening time of the candlestick. So if you move to lower timeframes the exact points will be shifted.
Best Regards,
Panagiotis
@PanagiotisCharalampous
PanagiotisCharalampous
02 Jul 2019, 09:12
Hi benpepperwhittaker,
From the screenshot ir is not clear what is the problem. Could you please send us two screenshots, one for W1 and one for H4 showing the difference you are writng about?
Best Regards,
Panagiotis
@PanagiotisCharalampous