Backtest shows Net -$7; equity chart shows more

Backtest shows Net -$7; equity chart shows more
21 Apr 2019, 14:10
Hello fellow cTraders:
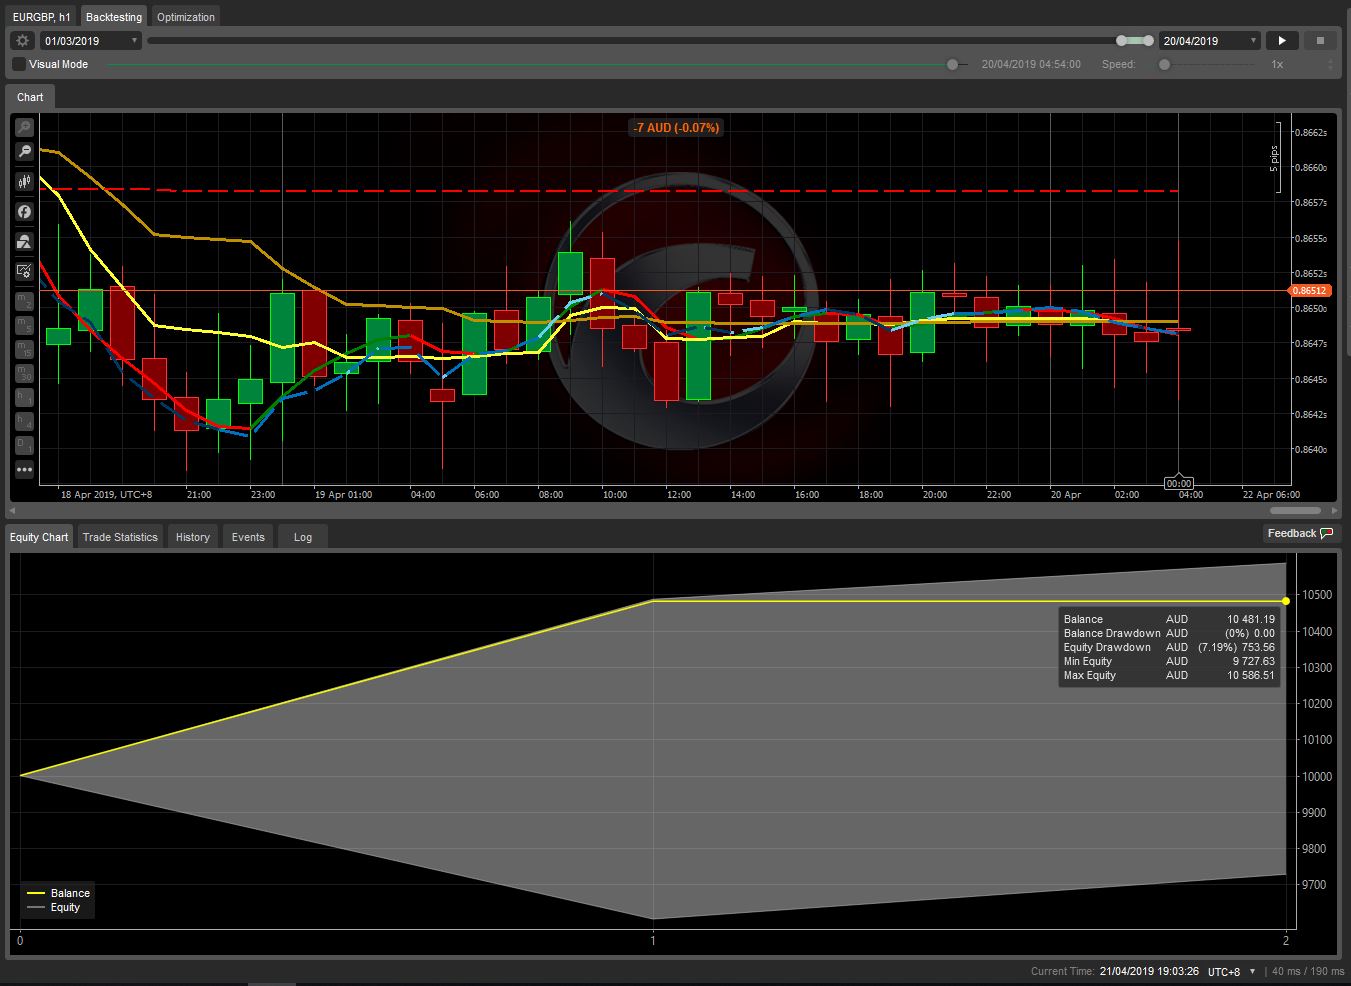
Can anyone explain these results to me? I did an automated backtest starting at $10,000. See the top chart says "-7 AUD"; yet the equity chart below shows the balance is over $10,400.
???
Thank you.
Replies
PanagiotisCharalampous
22 Apr 2019, 10:37
Hi FireMyst,
Can you post the cBot code?
Best Regards,
Panagiotis
@PanagiotisCharalampous
firemyst
25 Apr 2019, 11:26
RE:
Panagiotis Charalampous said:
Hi FireMyst,
Can you post the cBot code?
Best Regards,
Panagiotis
HI @Panagiotis:
No I am not posting this code unless I manage to come up with simpler code that reproduces the issue.
Maybe it's an issue related to the bug I reported here:
https://ctrader.com/forum/calgo-support/16336
?
@firemyst
firemyst
25 Apr 2019, 12:31
( Updated at: 21 Dec 2023, 09:21 )
RE:
Panagiotis Charalampous said:
Hi FireMyst,
Can you post the cBot code?
Best Regards,
Panagiotis
HI @Panagiotis:
I think I figured out what is happening. Look at these screen captures and hopefully you agree. :-)
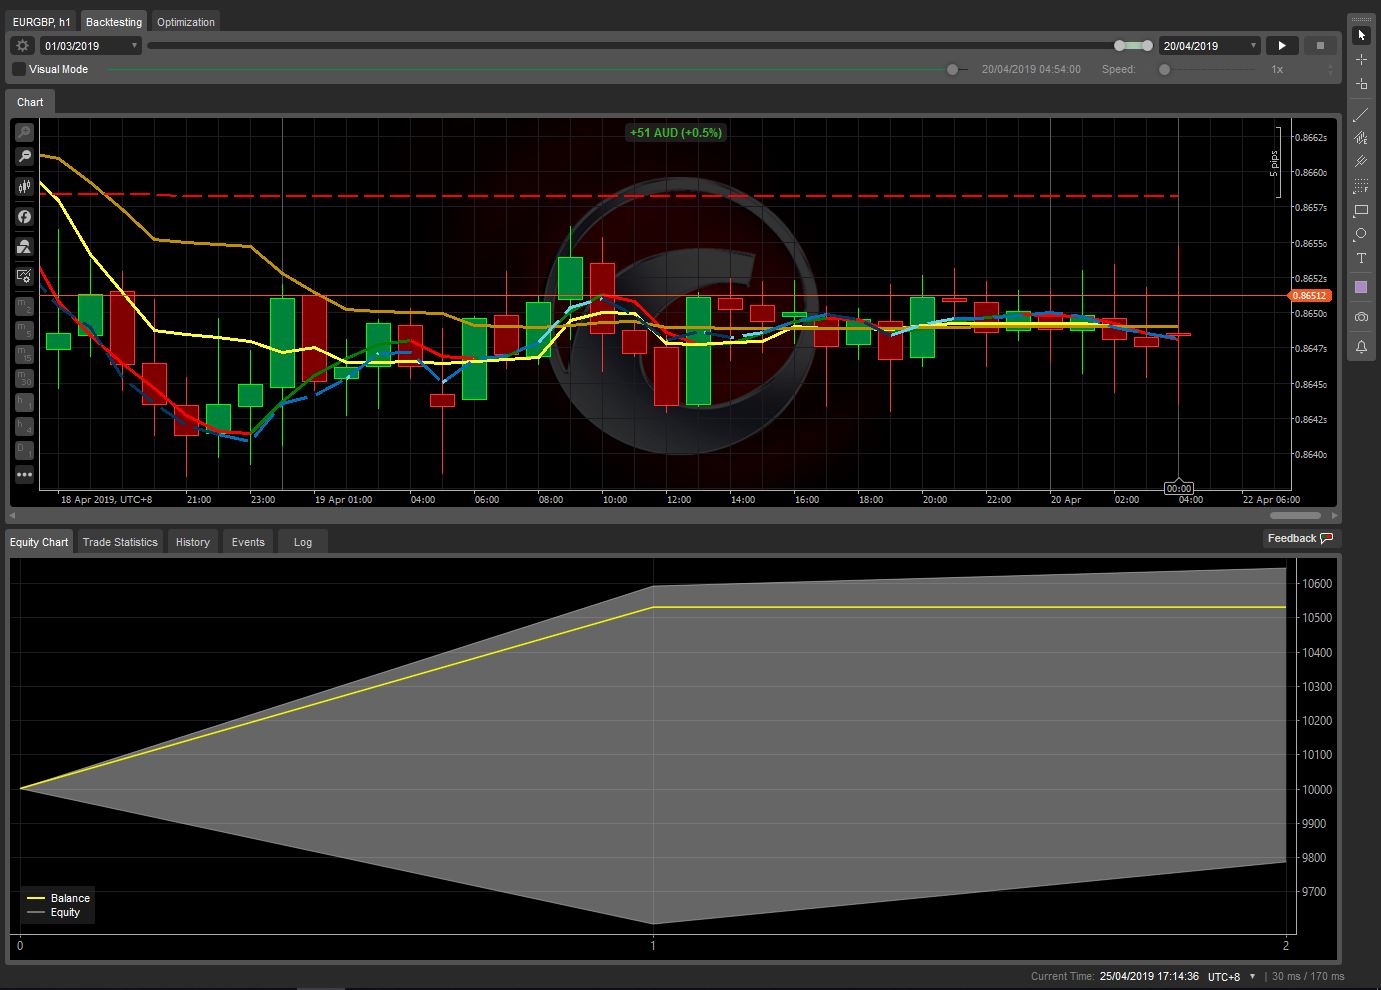
1) The equity chart is above $10,500. On the top portion though, it shows " +51" profit.
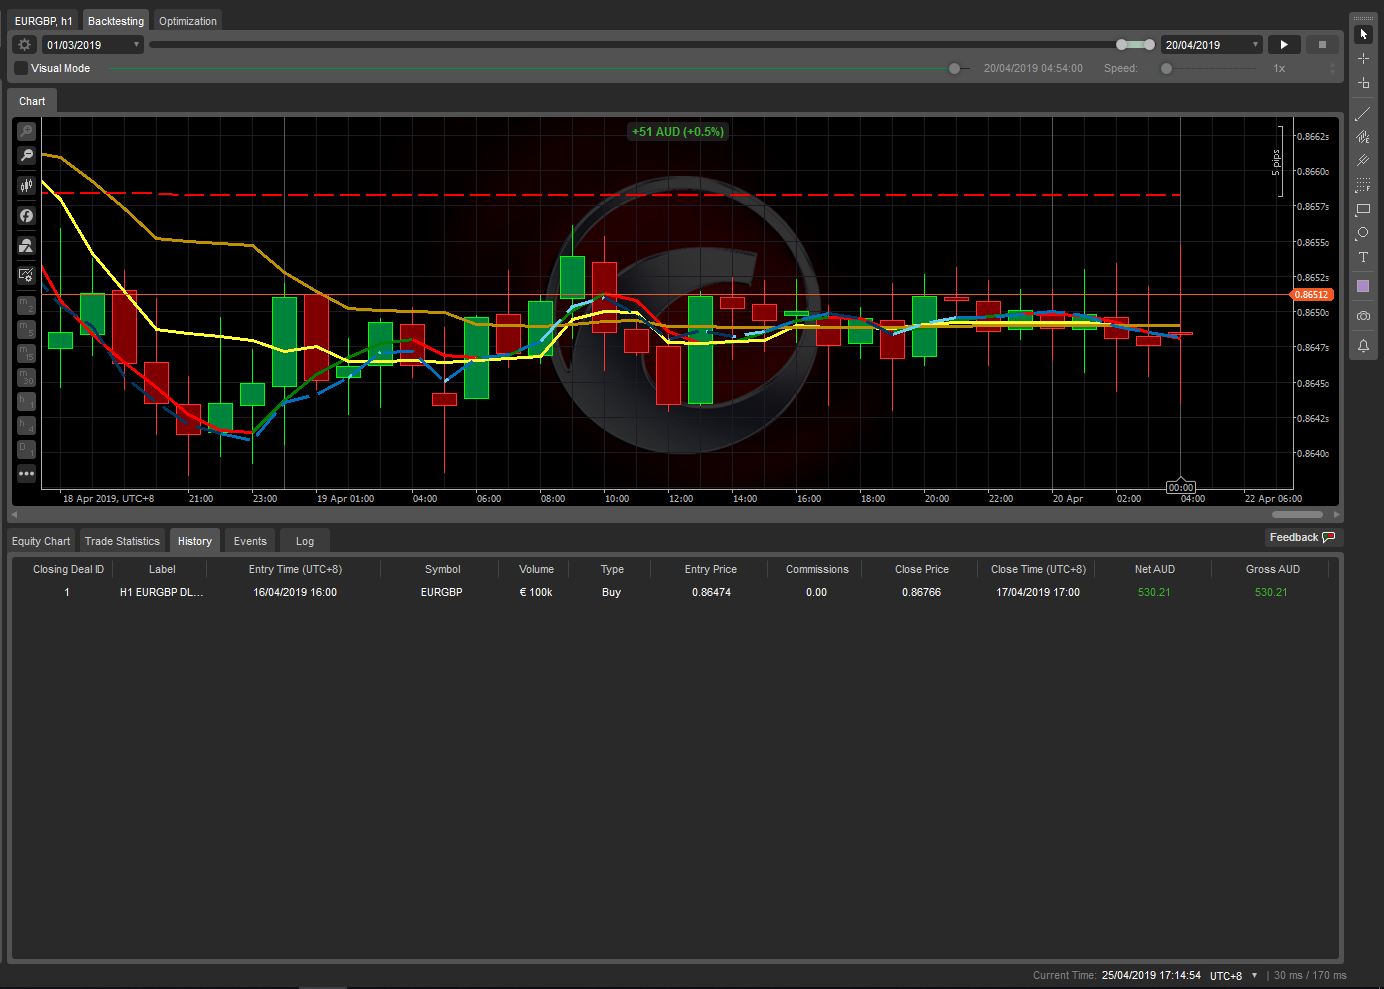
2) Under the "History tab" I have one trade that's profitable at $530.21.
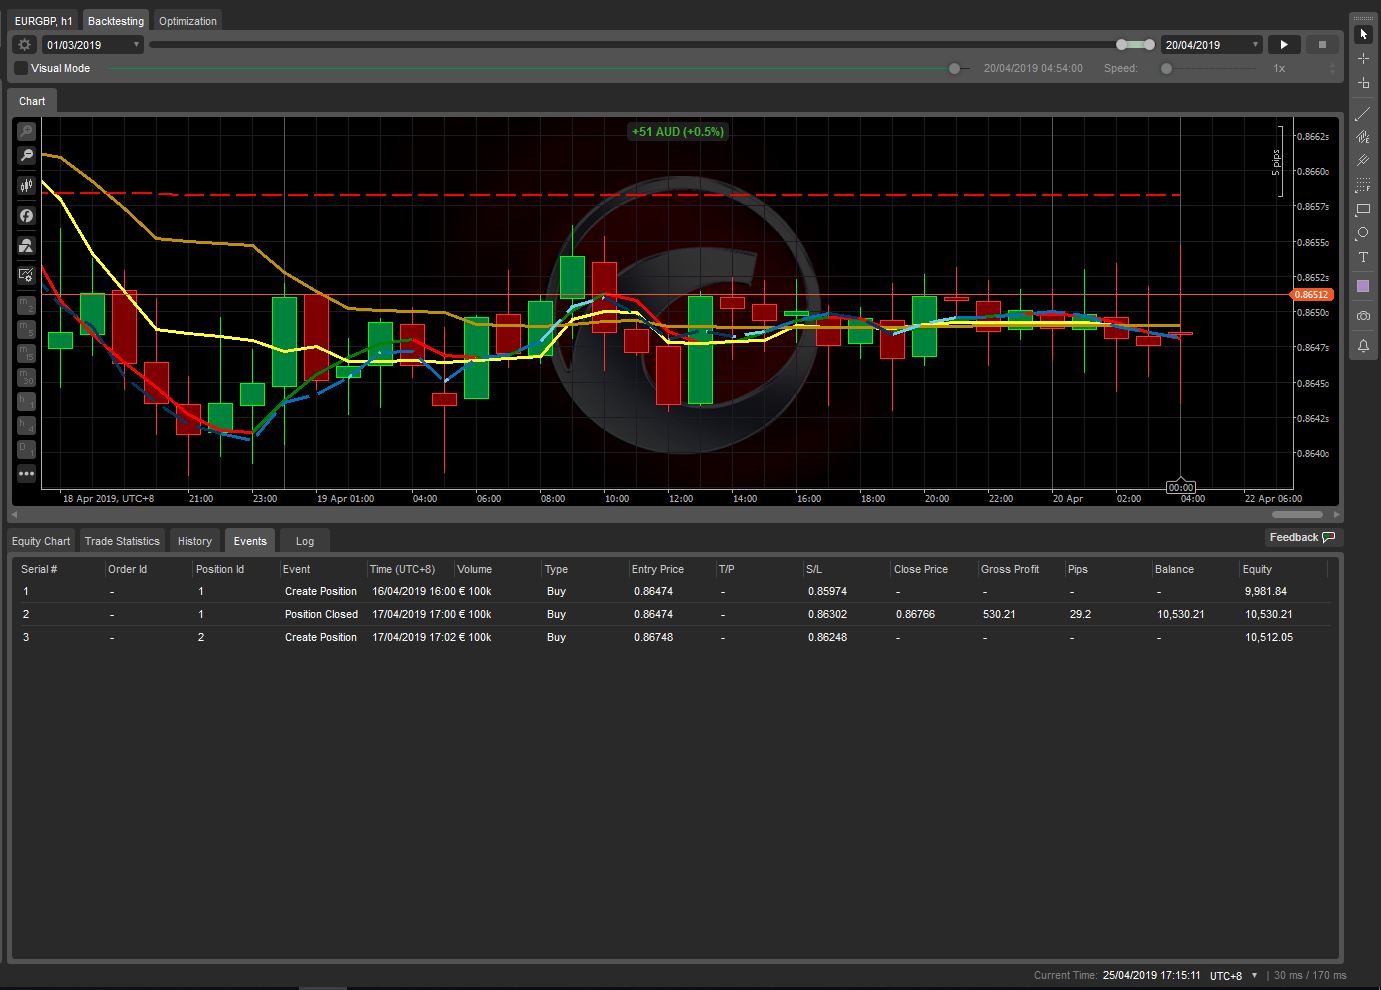
3) Under the "Events tab" It shows the first position that was opened/closed, then a second position that's opened, and still opened. You can see the details.
4) Here is the Trading Info.
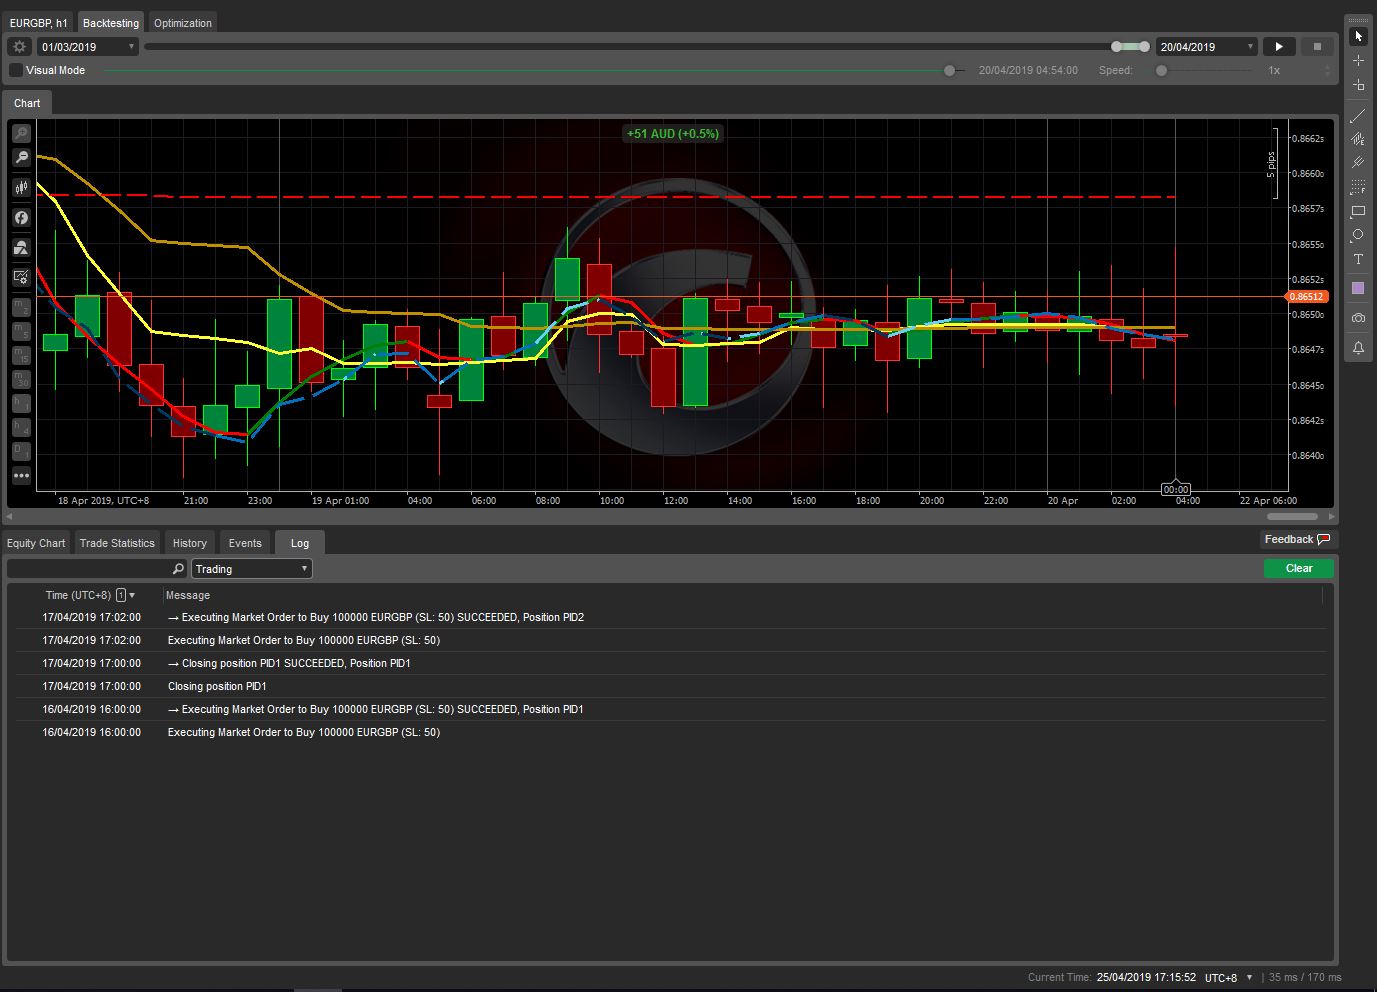
So it looks to me like what cTrader is saying (which is confusing) is:
1) I have a balance of over $10,500 AUD when the backtesting completes.
2) However, at the point at where the backtesting stopped, if the last position was to be closed out, I would only be up +$51 AUD overall because my current position is in a loss (bought at 0.86748 and last tick as indicated on chart is 0.86512 == -0.00236). But because it isn't closed, that's why my "balance" is over $10,500.
I'm not sure if all those pips/numbers add up to bring it down to only +51, but it seems reasonable.
Are you able to confirm if that's intended functionality? If so, I wonder if there's a better way to convey that difference? Like maybe somehow indicate the current balance, but then in parenthesis say, "(+$51 if last open position is closed)"?
If you agree/confirm the above functionality, that's great, and appreciate you looking into it. :-)
If not, let me know and I'll see if I can find a simple portion of the code to reproduce the results.
@firemyst
PanagiotisCharalampous
25 Apr 2019, 12:38
Hi FireMyst,
Probably this is what is happening but I cannot confirm if I do not execute this myself :)
Best Regards,
Panagiotis
@PanagiotisCharalampous
firemyst
06 May 2019, 12:11
( Updated at: 21 Dec 2023, 09:21 )
RE:
Panagiotis Charalampous said:
Hi FireMyst,
Probably this is what is happening but I cannot confirm if I do not execute this myself :)
Best Regards,
Panagiotis
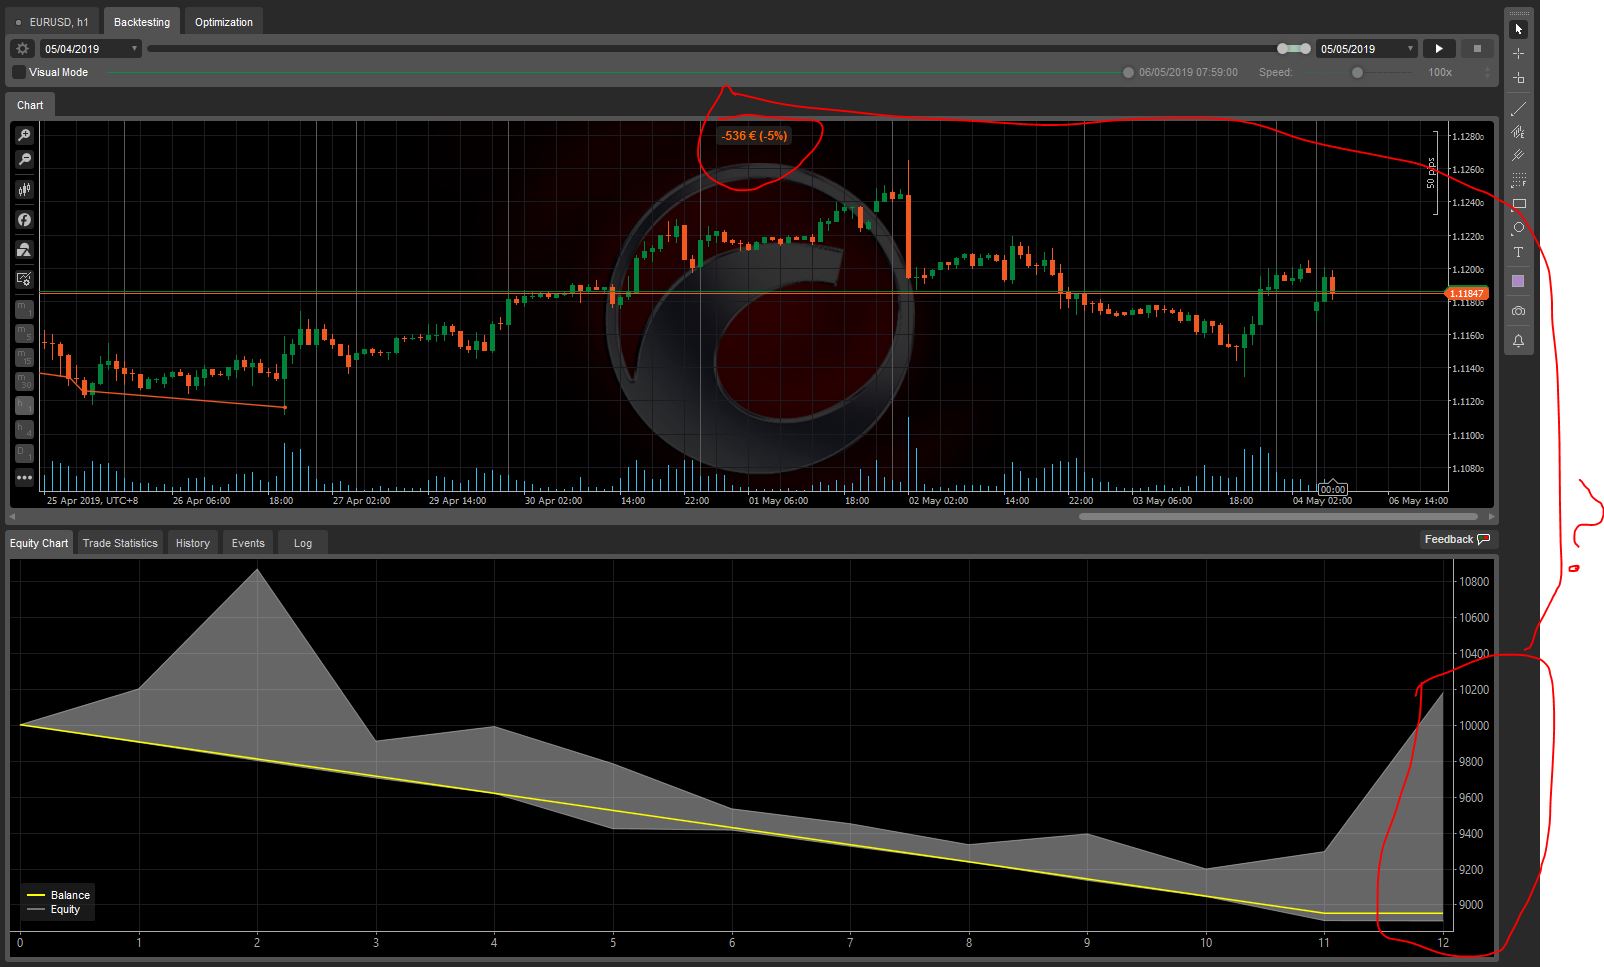
Here you go. Still doing it in cTrader 3.5 Beta. It says "-536" at the top, but at the bottom the "balance" is below 9000 and the equity is all over the place:
Here is the code so you can run it yourself:
using System;
using System.Linq;
using cAlgo.API;
using cAlgo.API.Indicators;
using cAlgo.API.Internals;
using cAlgo.Indicators;

namespace cAlgo.Robots
{
    [Robot(TimeZone = TimeZones.UTC, AccessRights = AccessRights.None)]
    public class TestBot : Robot
    {
        private string _positionLabel = String.Empty;
        private MarketSeries _marketSeries;

        protected override void OnStart()
        {
            _marketSeries = MarketData.GetSeries(Symbol, MarketSeries.TimeFrame);
            DataSeries series = _marketSeries.Close;
            _positionLabel = (MarketSeries.TimeFrame) + " " + Symbol.Code + " Test Bot";
        }

        protected override void OnTick()
        {
            if (SumOfLongEntryConditions() >= 5)
                Print("Hello");
            else
                Print("Oh no!");
            if (Positions.Count < 1)
                ExecuteMarketOrder(TradeType.Buy, Symbol, 100000, "test", 10, null);

        }

        private int SumOfLongEntryConditions()
        {
            int _sumOfLongEntryConditions = 4;
            return _sumOfLongEntryConditions;
        }
    }
}
I'll be eagerly awaiting :-)
@firemyst
PanagiotisCharalampous
08 May 2019, 09:58
Hi FireMyst,
I had a look at the cBot. Please note that the chart does not show the equity at the moment that the backtesting finishes but the max equity reached since the moment the last position was closed (in this case 07/03). In other words, it says that since the 07/03 till the 20/04, the max equity reached 10400. The balance shows correclty and the ending equity is calculated based on the unrealized P&L of the remaining open positions.
Let me know if this clarifies things.
Best Regards,
Panagiotis
@PanagiotisCharalampous
firemyst
08 May 2019, 10:40
( Updated at: 21 Dec 2023, 09:21 )
RE:
Panagiotis Charalampous said:
Hi FireMyst,
I had a look at the cBot. Please note that the chart does not show the equity at the moment that the backtesting finishes but the max equity reached since the moment the last position was closed (in this case 07/03). In other words, it says that since the 07/03 till the 20/04, the max equity reached 10400. The balance shows correclty and the ending equity is calculated based on the unrealized P&L of the remaining open positions.
Let me know if this clarifies things.
Best Regards,
Panagiotis
Hi @Panagiotis:
Unfortunately, your explanation doesn't make sense to me. What chart are you referring to since multiple ones are posted? In neither posting #5 or #7 do I see any place where either the graphing is around 10,400; in post#5 with the chart, the highest equity is $10,530 when position 1 is closed, and position 2 is still open. In Posting #1, there is no place where the equity is "-7".
To avoid confusion, let's stick with the code I have posted.
Here are the screen captures from running it with highlights on the screen. The TOP of the bar chart says,"-536". The "last position closed" according to the "events" tab, is 11 (3rd capture). The "equity" at that point, according to the events tab, is 9031 - 8951 -- neither of which is 536 below the starting balance of 10,000, correct?
So according to these charts, where does the -536 come from or how is it calculated from the results shown exactly?
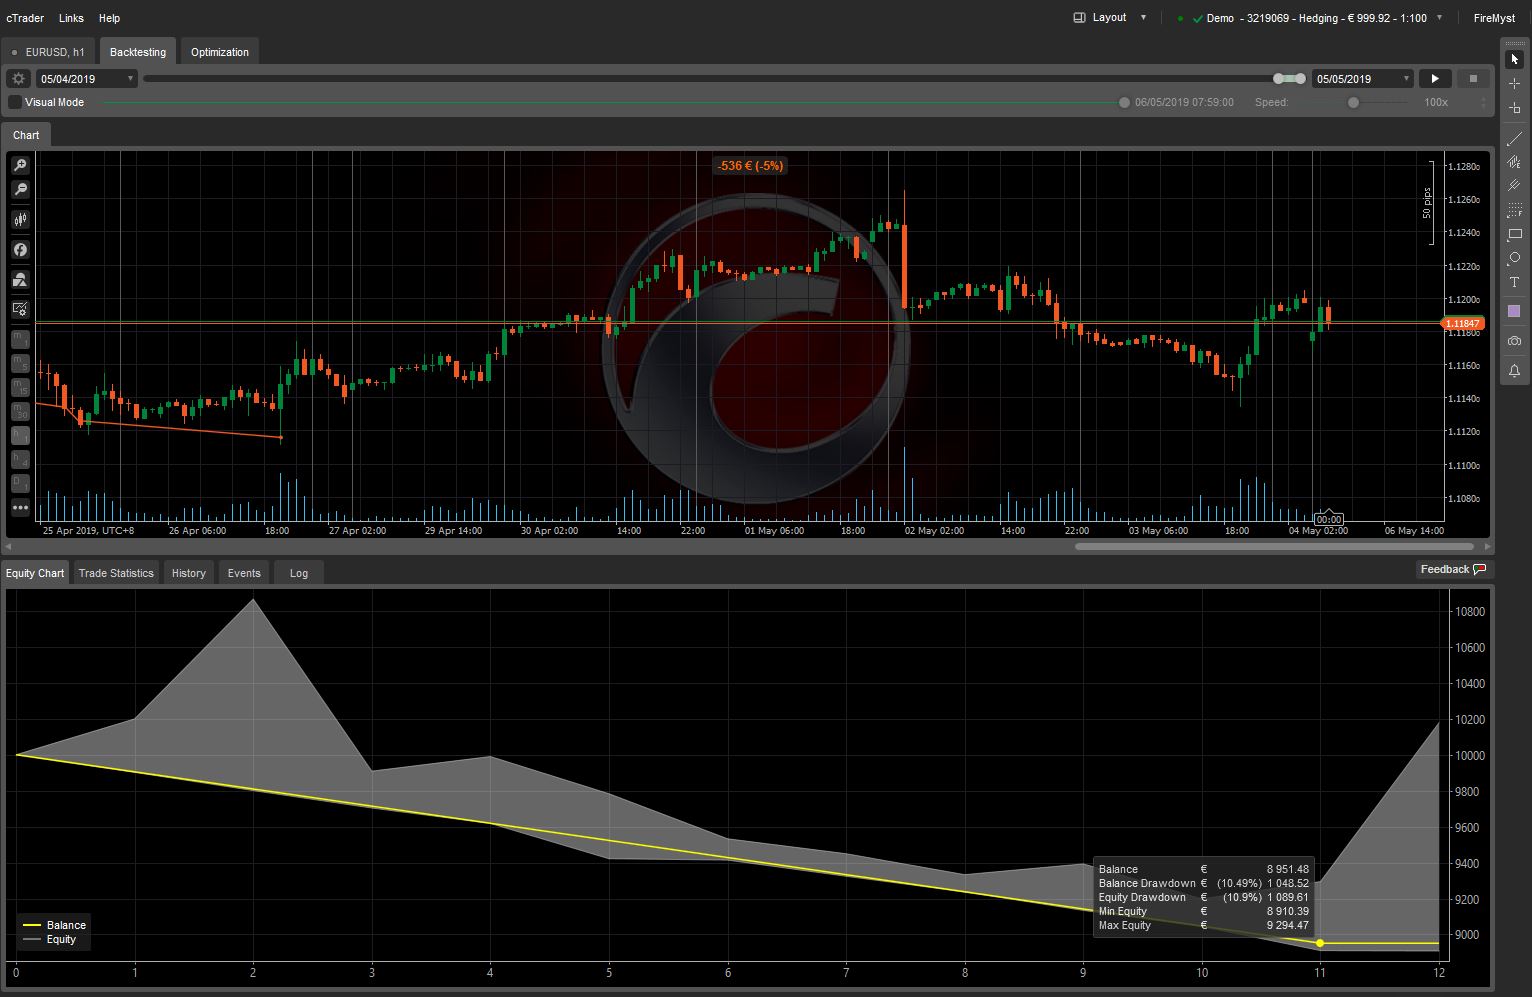
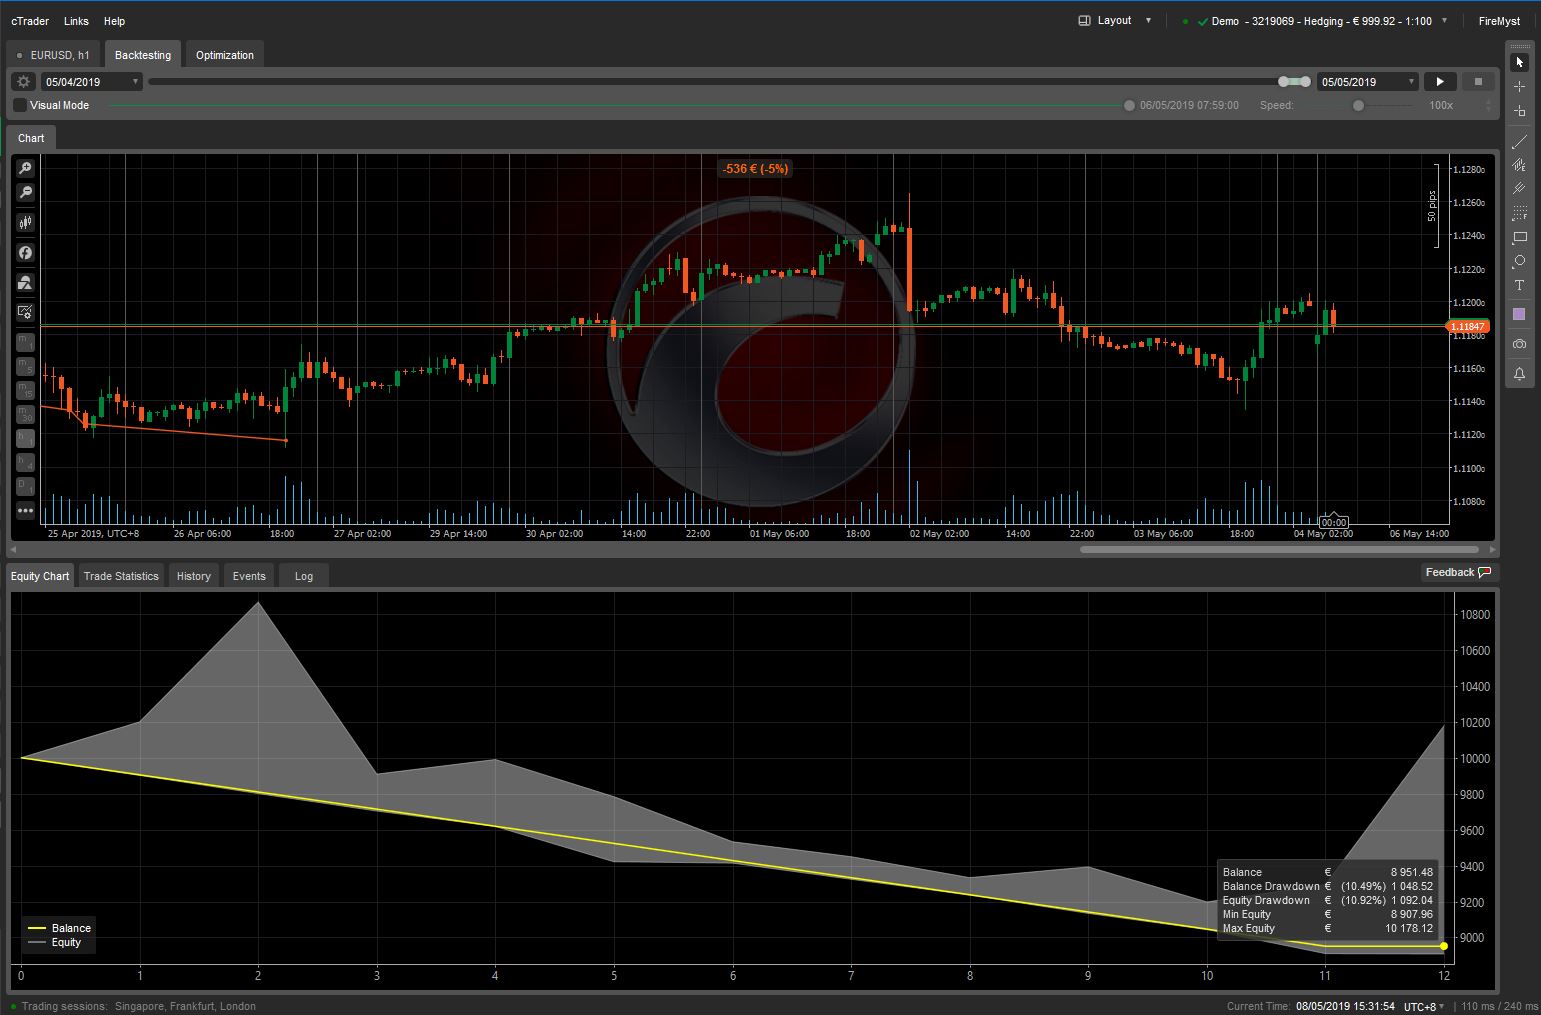
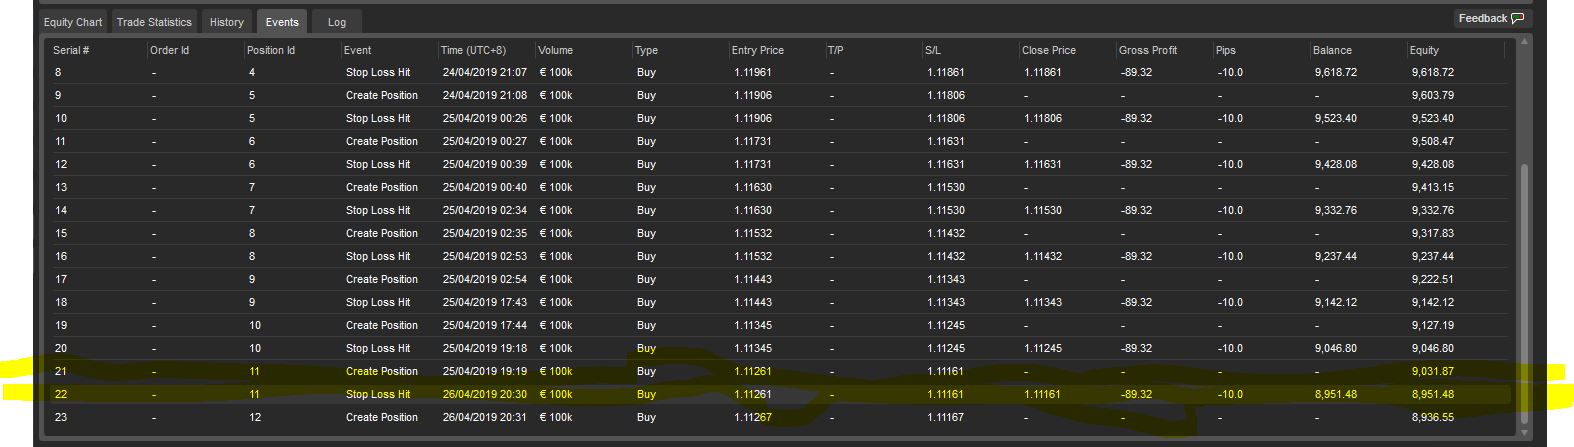
In the above two highlighted lines, both the "balance" and the equity is way lower than the -536 displayed on the top of the bar graph.
Thank you :-)
@firemyst
PanagiotisCharalampous
08 May 2019, 10:53
Hi FireMyst,
-536 represents the difference between the equity at the moment the cBot stops execution (05/05/2019) and the starting balance (you still have an open position with unrealized P&L). The highlighted values show the balance and equity on the 26/04/2019.
Best Regards,
Panagiotis
@PanagiotisCharalampous
PanagiotisCharalampous
08 May 2019, 11:01
Try running the backesting in Visual Mode. It might help you understand it better.
@PanagiotisCharalampous
firemyst
08 May 2019, 11:26
RE:
Panagiotis Charalampous said:
Try running the backesting in Visual Mode. It might help you understand it better.
OK, That makes a bit more sense now. I was reading those numbers at the top of the chart as the total overall gain/loss for the entire test period, which it can't obviously provide if there's still open positions when the bot comes to the end of the test period and positions are still open.
Thank you.
So am I correct to say then that if I have bots with parameters, and I want to see what parameter settings will give me the highest 'balance' at the end when the bot stops, I have to look at the "balance" line on the equity chart and compare the differences in runs between those different parameter settings?
For instance, if I started overall with 10,000 in my account, my current balance could be at 20,000 with a lot of good wins, the current trade is -536, meaning I have 19,400 (roughly) in equity, but overall at least a 9,400 gain since starting at 10,000 if I were to close everything out and take unrealized P&L.
Thus the "balance" line on the equity chart would be hovering around the 20,000 mark, with the 'equity' gray around coloured down to around the 19,400 area.
Is that about right?
@firemyst
Jonkey
22 Apr 2019, 03:45
It looks like the bot has taken a hedged position. And then closed a portion of the winning position...then the bot time frame ended without actually closing another trade... this is why the yellow line stays horizontal from 1 to 2... but the price action has shifted in a way that raises the high and low equity values but the mid equity balance average of long vs short volumes has shifted in a way that forces it off center between the high and low equity values. That is why I believe the equity could be -7... but I could be wrong as I can't see all the trades and I'm not quite smart enough to do the real time conversions between AUD and EUR and GBP... But I believe this can skew expected results of hedging strategies also. Welcome to the joys of zero sum games : D!
@Jonkey