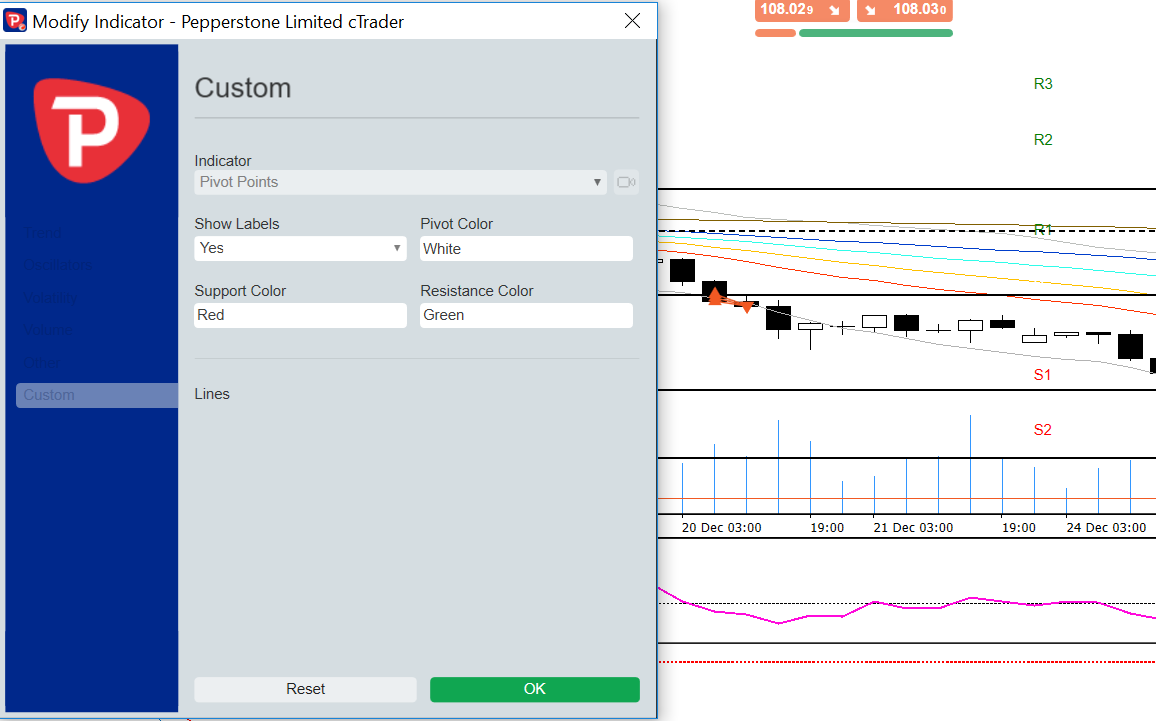
Cannot make the Pivot indicator work.
04 Jan 2019, 14:28
Hi!
I have a question regarding using Pivots.
I recently downloaded this indicator because I want to utilize Pivots: https://ctrader.com/algos/indicators/show/45
1) However, as you see on the picture, I can not see the pivot lines.
2) I can not change colors either; it says "pivot color, support color, resistance color", but I cannot change it. I can delete the letters and write manually other color but nothing happens.
3) I also want to be able to change the pivot inputs, so that I can both use daily pivots for intraday trading and weekly pivots for swinging. Is this possible? If so - how?

Replies
eirik_1993
04 Jan 2019, 15:14
RE:
Panagiotis Charalampous said:
Hi eirik_1993,
1) Pivot lines are hard coded to be white. See the below line of code
ChartObjects.DrawLine("pivot " + startIndex, pivotStartTime, pivot, pivotEndTime, pivot, Colors.White);2) Same as above. Line colors are hard coded.
ChartObjects.DrawLine("r1 " + startIndex, pivotStartTime, r1, pivotEndTime, r1, Colors.Green);
ChartObjects.DrawLine("r2 " + startIndex, pivotStartTime, r2, pivotEndTime, r2, Colors.Green);
ChartObjects.DrawLine("r3 " + startIndex, pivotStartTime, r3, pivotEndTime, r3, Colors.Green);
ChartObjects.DrawLine("s1 " + startIndex, pivotStartTime, s1, pivotEndTime, s1, Colors.Red);
ChartObjects.DrawLine("s2 " + startIndex, pivotStartTime, s2, pivotEndTime, s2, Colors.Red);
ChartObjects.DrawLine("s3 " + startIndex, pivotStartTime, s3, pivotEndTime, s3, Colors.Red);
3) If you need additional functionality you post a Job or contact a Consultant.
Best Regards,
Panagiotis
Okay, I am a bit surprised that I have to pay for a feature that MT4 and Tradingview offers for free, but I will look into that.
Hope it is okay that I use this thread to ask a different question so that I don't have to create a new thread:
How do I hide the indicators at the bottom of the screen such as RSI, Stoch, MACD etc.? In Tradingview I just doubleclick the screen and it pops down/up. Is it possible, or must I delete them and apply again?
Thanks!
@eirik_1993
PanagiotisCharalampous
04 Jan 2019, 16:06
Hi eirik_1993,
The indicator is offered by the community for free as is. If you want additional features, you need to either implement them yourself or find somebody to do the job for you, either for free of for a fee. I don't know if you can find somebody to help you for free but if anyone is willing to do so, even better :).
Regarding the new question, you cannot hide indicators in cTrader. If you want them to disappear completely, you need to delete them.
Best Regards,
Panagiotis
@PanagiotisCharalampous

PanagiotisCharalampous
04 Jan 2019, 14:51
Hi eirik_1993,
1) Pivot lines are hard coded to be white. See the below line of code
ChartObjects.DrawLine("pivot " + startIndex, pivotStartTime, pivot, pivotEndTime, pivot, Colors.White);2) Same as above. Line colors are hard coded.
ChartObjects.DrawLine("r1 " + startIndex, pivotStartTime, r1, pivotEndTime, r1, Colors.Green);
ChartObjects.DrawLine("r2 " + startIndex, pivotStartTime, r2, pivotEndTime, r2, Colors.Green);
ChartObjects.DrawLine("r3 " + startIndex, pivotStartTime, r3, pivotEndTime, r3, Colors.Green);
ChartObjects.DrawLine("s1 " + startIndex, pivotStartTime, s1, pivotEndTime, s1, Colors.Red);
ChartObjects.DrawLine("s2 " + startIndex, pivotStartTime, s2, pivotEndTime, s2, Colors.Red);
ChartObjects.DrawLine("s3 " + startIndex, pivotStartTime, s3, pivotEndTime, s3, Colors.Red);
3) If you need additional functionality you post a Job or contact a Consultant.
Best Regards,
Panagiotis
@PanagiotisCharalampous