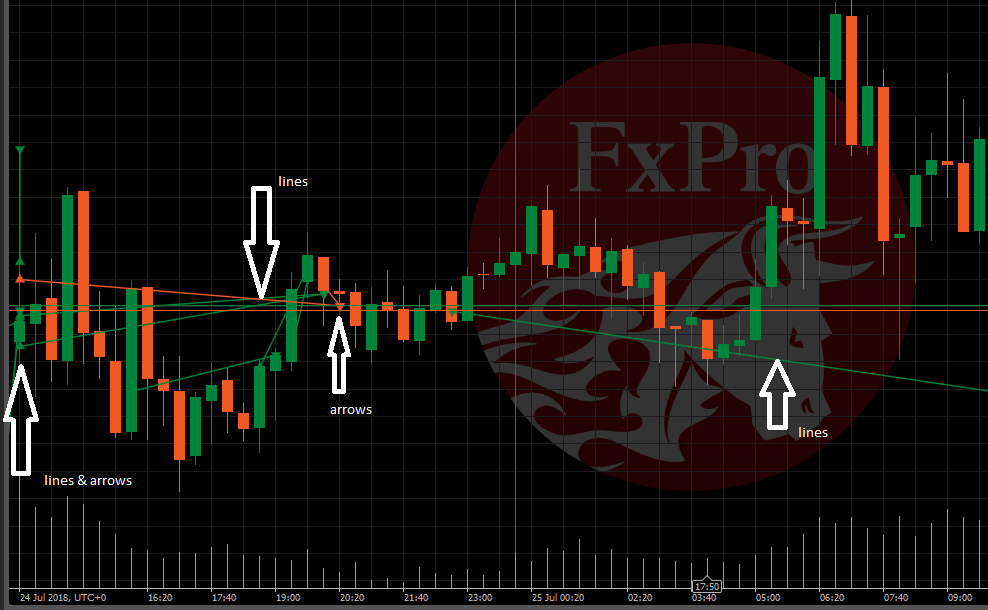
What are these?
25 Jul 2018, 19:11
Hi everyone, my first post as I'm totally new to Forex.
I'm trying to learn about FX and Ctrader while following Alex's videos which are awsome!
On my graph Ihave various lines and arrows - is this something I've added in my noobiness and is it something I can remove as its annoying me while im trying to copy Alex.
Looking forward to working with the community.
Thanks
Richard

Replies
ctid362150
26 Jul 2018, 16:20
Actually, this is another thing I've noticed with the Web bsed version Panagiotis.
When you click on a trade in the history panel, the deal map displays for that trade. If you then unselect 'deal map' from the options, and then go to another trading pair tab, then back to the original tab. The deal map is again displaying.
For instance, I go into history and select a past trade for XTIUSD. The XTIUSD chart comes to focus showing that trades buy & sell deal map. I then unselect 'deal map' in the options. I then go to the XBRUSD chart, and back to the XTIUSD chart and the XTIUSD 'deal map' is showing again.
The only way I can get rid of it is to close cTrader down and re-open it.
@ctid362150
PanagiotisCharalampous
26 Jul 2018, 16:30
Hi Richard,
Thanks for noticing this. I will report it to the QA team for investigation.
Best Regards,
Panagiotis
@PanagiotisCharalampous

PanagiotisCharalampous
26 Jul 2018, 09:26
Dear Richard,
Welcome to the cTrader community. These lines visualize your deals and all of them together are called the deal map. The starting point represents the price and entry time of your opening deal and the ending point is the price and entry time of your closing deal. If you want to remove the deal map from the graph, just right click, go to Viewing Options and uncheck Deal Map.
Best Regards,
Panagiotis
@PanagiotisCharalampous