NEW UPDATE HORRID. NEED HELP!

NEW UPDATE HORRID. NEED HELP!
30 May 2018, 01:38
Remove the left bar. Put it as a drop down option from the top menu bar.
Change the time frame defaults, I have to scroll down to change to 4HR and Higher.
Is there a way to remove 1 2 3 4 5 6 7 8 minutes like are u being serious.
Drawing tool bar has gone missing. Cant find any where to get it back.
Overall too clunky and messy, previous version way better.
Anyone have solutions to these problems pls reply.
Replies
niwi@niwi.nz
01 Jun 2018, 10:22
Additionally, a tooltip of the indicators superimposed over the measuring tool, so i can't clearly see the number of pips there are between some candle and some other that is located near one indicator (Moving Average is a good example), please, fix that, is very very uncomfortable.
@niwi@niwi.nz
Mykhaylo Loboyko
01 Jun 2018, 12:14
( Updated at: 21 Dec 2023, 09:20 )
Hello!
Thanks for the valuable feedback regarding the recent update. We will be taking all of your comments into consideration.
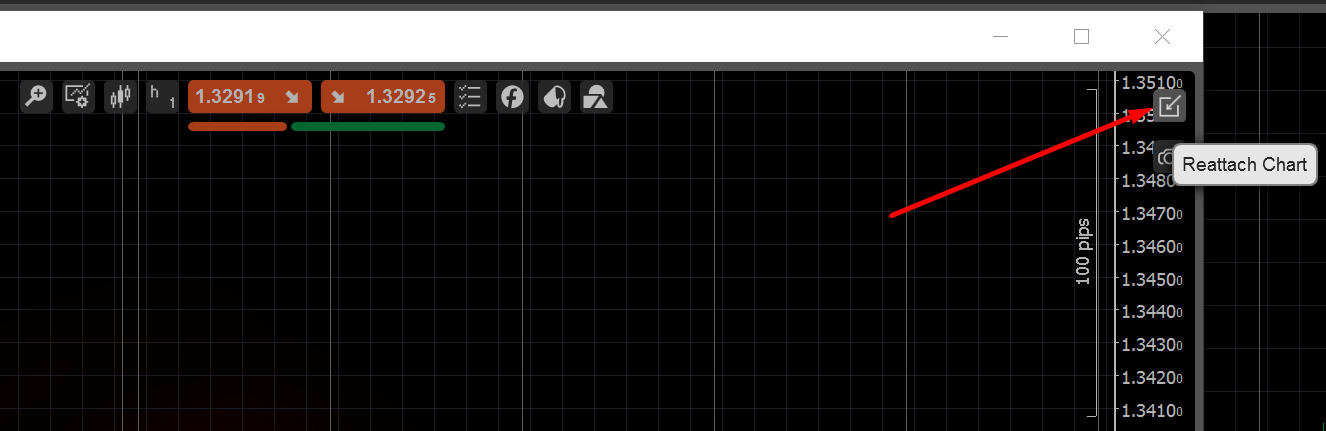
Regarding, detaching a chart and closing the detached chart. You can reattach the chart using Reattach Chart button in the top right corner of the chart area specifically designed for this purpose.
@Mykhaylo Loboyko
PanagiotisCharalampous
05 Jun 2018, 11:09
RE:
niwi@niwi.nz said:
Additionally, a tooltip of the indicators superimposed over the measuring tool, so i can't clearly see the number of pips there are between some candle and some other that is located near one indicator (Moving Average is a good example), please, fix that, is very very uncomfortable.
Hi, please see below
/forum/ctrader-support/13145
@PanagiotisCharalampous
tt6052
06 Jun 2018, 05:41
( Updated at: 21 Dec 2023, 09:20 )
RE:
Yes, I understand that button is there. I am just pointing out it was more easier before, where youd just hit the X and the chart would reattach, I assume quite a number of people would have lost their charts due to this change.
Mykhaylo Loboyko said:
Hello!
Thanks for the valuable feedback regarding the recent update. We will be taking all of your comments into consideration.
Regarding, detaching a chart and closing the detached chart. You can reattach the chart using Reattach Chart button in the top right corner of the chart area specifically designed for this purpose.
@tt6052
vivo19
30 May 2018, 09:02
Yes scrolling down for 4h or higher timeframes is very annoying. We need ability to remove all these new timeframes 2,3,4,6,7,8,9.
@vivo19