ChartObjects.DrawLine: number of days
26 Jan 2016, 12:01
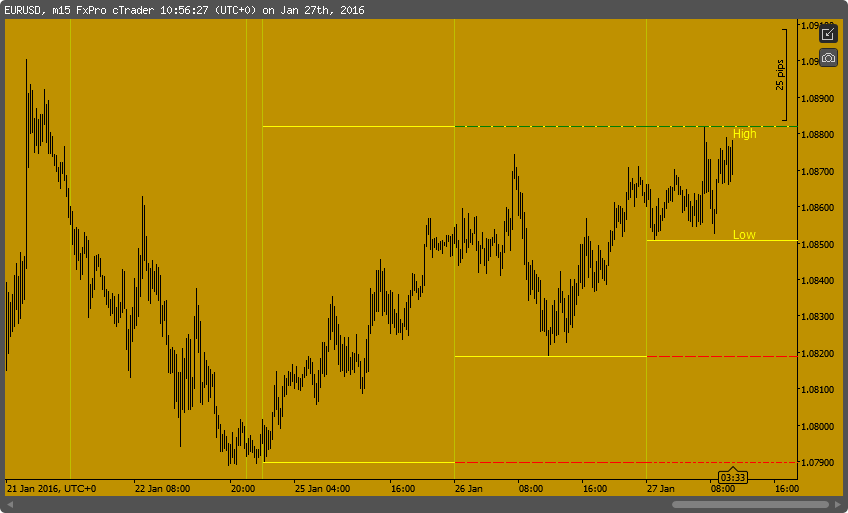
Is it possible to draw lines for a certain number of days?
For one day:
ChartObjects.DrawLine("Name", today, high, tomorrow, high, Colors.Black, 1);
For every day:
ChartObjects.DrawLine("Name" + today, today, high, tomorrow, high, Colors.Black, 1);
For a number of days:
?
Replies
MaVe
26 Jan 2016, 21:07
RE:
Dear Spotware,
To be more specific: I want to be able to modify my first published Indicator:
/algos/indicators/show/1083
As such:
- Only 3 Daily High Low lines visible (today, yesterday, day before yesterday)
- These 3 Daily High/Low Lines are each projected 2 days in the future.
Is there another example to explain the logic of using the coordinates,
because it is not clear to me at the moment how to implement it.
@MaVe
Spotware
26 Jan 2016, 21:16
Dear Trader,
Please have a look at this Indicator:Trend Lines Indicator
@Spotware
MaVe
27 Jan 2016, 13:14
( Updated at: 21 Dec 2023, 09:20 )
Another approach for the moment:
Still based on the example /forum/whats-new/913#4
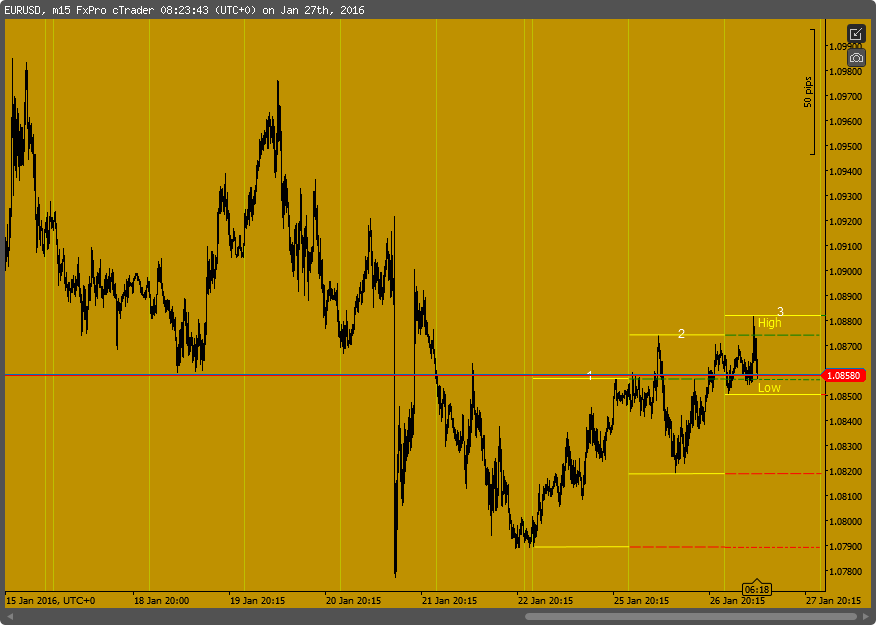
When I draw all the necessary lines separately, The result looks as seen on the chart below.
However, at the moment, the Yesterday high line and TheDayBeforeYesterday high line move up with the today's high.
Where is the failure in the code below??

// Testversion
using System;
using cAlgo.API;
namespace cAlgo.Indicators
{
[Indicator(IsOverlay = true, AutoRescale = false, TimeZone = TimeZones.UTC, AccessRights = AccessRights.None)]
public class TripleDailyHL : Indicator
{
public override void Calculate(int index)
{
DateTime today = MarketSeries.OpenTime[index].Date;
DateTime today1 = today.AddDays(1);
DateTime today2 = today.AddDays(2);
DateTime today3 = today.AddDays(3);
DateTime previous1 = today.AddDays(-1);
DateTime previous2 = today.AddDays(-2);
DateTime previous3 = today.AddDays(-3);
double high1 = MarketSeries.High.Last(2);
double low1 = MarketSeries.Low.Last(2);
double high2 = MarketSeries.High.Last(1);
double low2 = MarketSeries.Low.Last(1);
double high = MarketSeries.High.Last(0);
double low = MarketSeries.Low.Last(0);
// ----- Today
for (int i = MarketSeries.Close.Count - 1; i > 0; i--)
{
if (MarketSeries.OpenTime[i].Date < today)
break;
high = Math.Max(high, MarketSeries.High[i]);
low = Math.Min(low, MarketSeries.Low[i]);
}
ChartObjects.DrawLine("HOD-Line3 ", today, high, today1, high, Colors.Yellow, 1);
ChartObjects.DrawLine("LOD-Line3 ", today, low, today1, low, Colors.Yellow, 1);
ChartObjects.DrawText("HOD-Text ", "High", index, high, VerticalAlignment.Bottom, HorizontalAlignment.Right, Colors.Yellow);
ChartObjects.DrawText("LOD-Text ", "Low", index, low, VerticalAlignment.Top, HorizontalAlignment.Right, Colors.Yellow);
// ----- Yesterday
for (int i = MarketSeries.Close.Count - 1; i > 0; i--)
{
if (MarketSeries.OpenTime[i].Date < previous1)
break;
high2 = Math.Max(high2, MarketSeries.High[i]);
low2 = Math.Min(low2, MarketSeries.Low[i]);
}
ChartObjects.DrawLine("HOD-Line2 ", previous1, high2, today, high2, Colors.Yellow, 1);
ChartObjects.DrawLine("LOD-Line2 ", previous1, low2, today, low2, Colors.Yellow, 1);
ChartObjects.DrawLine("pHOD-Line2 ", today, high2, today1, high2, Colors.Green, 1, LineStyle.Lines);
ChartObjects.DrawLine("pLOD-Line2 ", today, low2, today1, low2, Colors.Red, 1, LineStyle.Lines);
// ----- DayBeforeYesterday
for (int i = MarketSeries.Close.Count - 1; i > 0; i--)
{
if (MarketSeries.OpenTime[i].Date < previous2)
break;
high1 = Math.Max(high1, MarketSeries.High[i]);
low1 = Math.Min(low1, MarketSeries.Low[i]);
}
ChartObjects.DrawLine("HOD-Line1 ", previous2, high1, previous1, high1, Colors.Yellow, 1);
ChartObjects.DrawLine("LOD-Line1 ", previous2, low1, previous1, low1, Colors.Yellow, 1);
ChartObjects.DrawLine("pHOD-Line1 ", previous1, high1, today, high1, Colors.Green, 1, LineStyle.Lines);
ChartObjects.DrawLine("pLOD-Line1 ", previous1, low1, today, low1, Colors.Red, 1, LineStyle.Lines);
ChartObjects.DrawLine("ppHOD-Line1 ", today, high1, today1, high1, Colors.Green, 1, LineStyle.LinesDots);
ChartObjects.DrawLine("PPLOD-Line1 ", today, low1, today1, low1, Colors.Red, 1, LineStyle.LinesDots);
}
}
}
@MaVe
whis.gg
27 Jan 2016, 22:12
Hey MaVe,
Take a look at this, I think it does what you want. :)
using System;
using cAlgo.API;
using cAlgo.API.Internals;
namespace cAlgo.Indicators
{
[Indicator(IsOverlay = true, AutoRescale = false, TimeZone = TimeZones.UTC, AccessRights = AccessRights.None)]
public class DailyHighLow : Indicator
{
[Parameter("Days To Show", DefaultValue = 3)]
public int DaysToShow { get; set; }
[Parameter("Extend (Days)", DefaultValue = 2)]
public int ExtendInDays { get; set; }
private MarketSeries daily;
protected override void Initialize()
{
daily = MarketData.GetSeries(TimeFrame.Daily);
}
public override void Calculate(int index)
{
DateTime today = DateTime.UtcNow.Date;
for (int i = 0; i < DaysToShow; i++)
{
DateTime startOfDay = today.AddDays(-i);
DateTime endOfDay = today.AddDays(1 - i);
var high = daily.High.Last(i);
var low = daily.Low.Last(i);
ChartObjects.DrawLine("DailyHigh" + i, startOfDay, high, endOfDay, high, Colors.Yellow, 1);
ChartObjects.DrawLine("DailyLow" + i, startOfDay, low, endOfDay, low, Colors.Yellow, 1);
ChartObjects.DrawLine("DailyHighExtended" + i, endOfDay, high, endOfDay.AddDays(ExtendInDays), high, Colors.Green, 1, LineStyle.Lines);
ChartObjects.DrawLine("DailyLowExtended" + i, endOfDay, low, endOfDay.AddDays(ExtendInDays), low, Colors.Red, 1, LineStyle.Lines);
}
}
}
}
@whis.gg
chkmitnb
10 Jun 2016, 08:23
RE:
tmc. said:
Try this.
for (int i = 0; i < DaysToDraw; i++)
{
    var startOfDay = today.AddDays(i);
    var endOfDay = today.AddDays(i-1);

    ChartObjects.DrawLine("line" + i, startOfDay, high, endOfDay, high, Colors.Black, 1);
}
10/06/2016 11:43:43.296 | Crashed in OnTick with ArgumentException: The conversion could not be completed because the supplied DateTime did not have the Kind property set correctly. For example, when the Kind property is DateTimeKind.Local, the source time zone must be TimeZoneInfo.Local. Parameter name: sourceTimeZone
I try the upper code, But it have some message. How I can to do?.
@chkmitnb


Spotware
26 Jan 2016, 18:41
Dear Trader,
It is possible. Please have a look at the following Indicator: Draw Objects to take an idea how to identify the coordinates.
@Spotware