Y Axis - Show Only Specific Values

Y Axis - Show Only Specific Values
13 Feb 2025, 14:31
Hi,
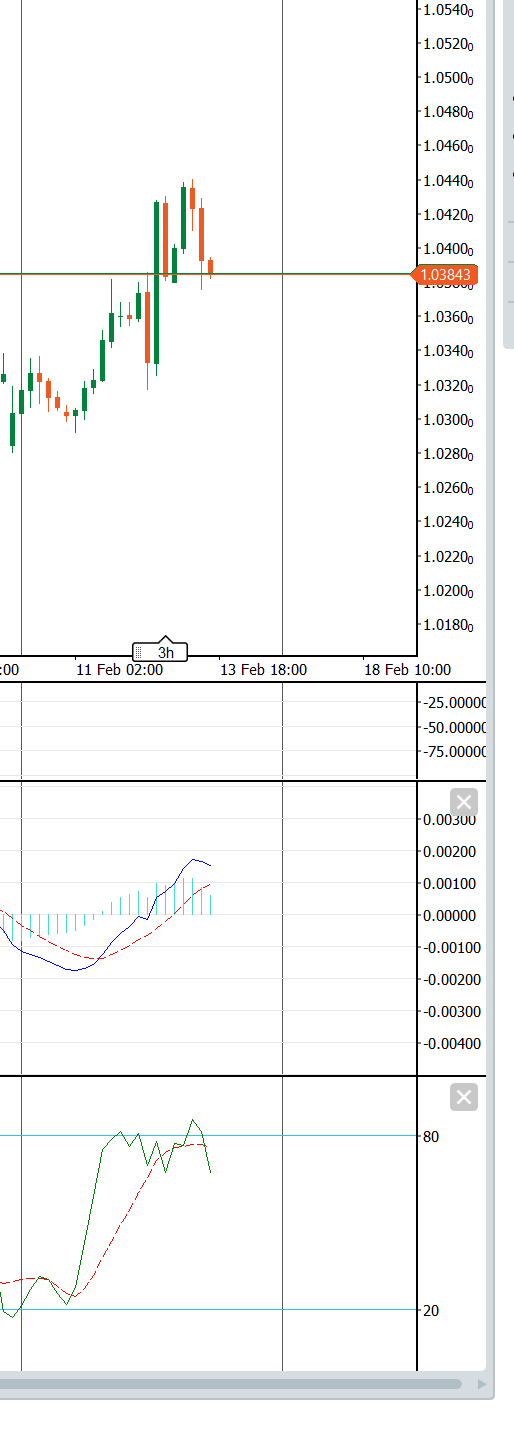
In the attached screenshot the bottom indicator pane shows the inbuilt Stochastic indicator and how it only plots 80 and 20 on the y axis, the indicator pane above that is a custom indicator and I also need to only show specific Y values however I can't find anywhere to set this. Where can I set it or how does the built in Stochastic indicator do it?
Also in the custom indicator each Y value has a light grey horizontal line even when I've disabled the grid viewing option. How do I disable this?
Thanks
Replies
tmfd
18 Feb 2025, 10:59
Thanks for the reply, however I'm referring to how to specify only certain y axis points are displayed this in code in my own indicator. The built in stochastic indicator does it somehow although the source code isn't available. I can't find any method of property that allows these values to be set.
@tmfd
firemyst
18 Feb 2025, 13:35
( Updated at: 18 Feb 2025, 13:36 )
RE: Y Axis - Show Only Specific Values
tmfd said:
Thanks for the reply, however I'm referring to how to specify only certain y axis points are displayed this in code in my own indicator. The built in stochastic indicator does it somehow although the source code isn't available. I can't find any method of property that allows these values to be set.
Read my previous reply.
You have to use the “Levels” attribute in your code.
For example:
[Levels(0.0, 1, -1)]
will only display the values -1, 0, 1 along the Y-axis.
The Stochastic indicator uses [Levels(20,80)] to only show the 20/80 levels you see.
That is the only way to set the levels, and you cannot programmatically change them.
When you change them in your code and recompile your indicator, make sure to click the “reset” button in your indicator's property's window to see the latest changes take effect.
@firemyst
tmfd
18 Feb 2025, 14:07
RE: RE: Y Axis - Show Only Specific Values
firemyst said:
tmfd said:
Thanks for the reply, however I'm referring to how to specify only certain y axis points are displayed this in code in my own indicator. The built in stochastic indicator does it somehow although the source code isn't available. I can't find any method of property that allows these values to be set.
Read my previous reply.
You have to use the “Levels” attribute in your code.
For example:
[Levels(0.0, 1, -1)]
will only display the values -1, 0, 1 along the Y-axis.
The Stochastic indicator uses [Levels(20,80)] to only show the 20/80 levels you see.
That is the only way to set the levels, and you cannot programmatically change them.
When you change them in your code and recompile your indicator, make sure to click the “reset” button in your indicator's property's window to see the latest changes take effect.
Thanks! That's sorted it.
Sorry I saw the screenshot and didn't read your original reply properly.
Thanks for your help, much appreciated.
@tmfd
firemyst
18 Feb 2025, 01:06
Set the “Levels” attribute in your indicator's code.
Google “calgo Levels” for more info.
Or when placing the indicator on the chart, manually set the levels. For example:
@firemyst