Chart rendering issue
18 Jan 2025, 17:29
Hi,
Firstly, I'm very new to using cTrader, and have been attempting to teach myself cAlgo/.NET. To that end I decided to try and implement a smoothed Heiken Ashi Overlay indicator/cBot - for no good reason other than I liked the simplicity of trend direction such a thing can provide, and thought it shouldn't be too complicated ;) (Besides, I liked it on Tradingview anyway, and yes, I know standard HA charts are available in CTrader)
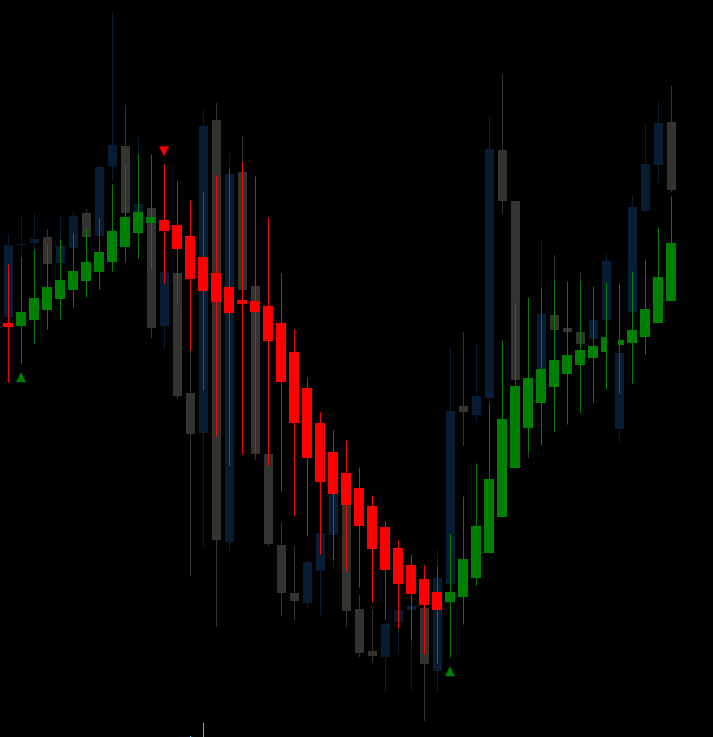
It's going ok for the most part - this is with low smoothing levels on an hourly chart:
The rendering issue I'm having (same chart with smoothing disabled, regular candles in the background and zoomed in a bit to the problem):
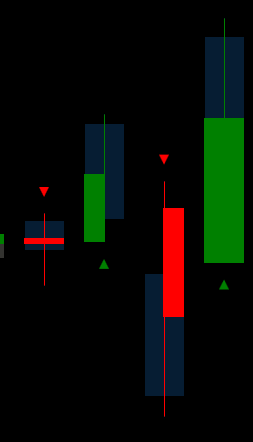
Exactly the same logic, for some reason refuses to draw these middle two candles correctly - as you can see half of them are missing, and upon investigating this it turns out that this represents the weekend gap in trading when most markets are closed (this is a Forex pair btw, and ignore the triangles they were a debug item to troubleshoot an earlier problem).
This is the candle drawing logic - I couldn't find an API call to draw candles, so threw this together:
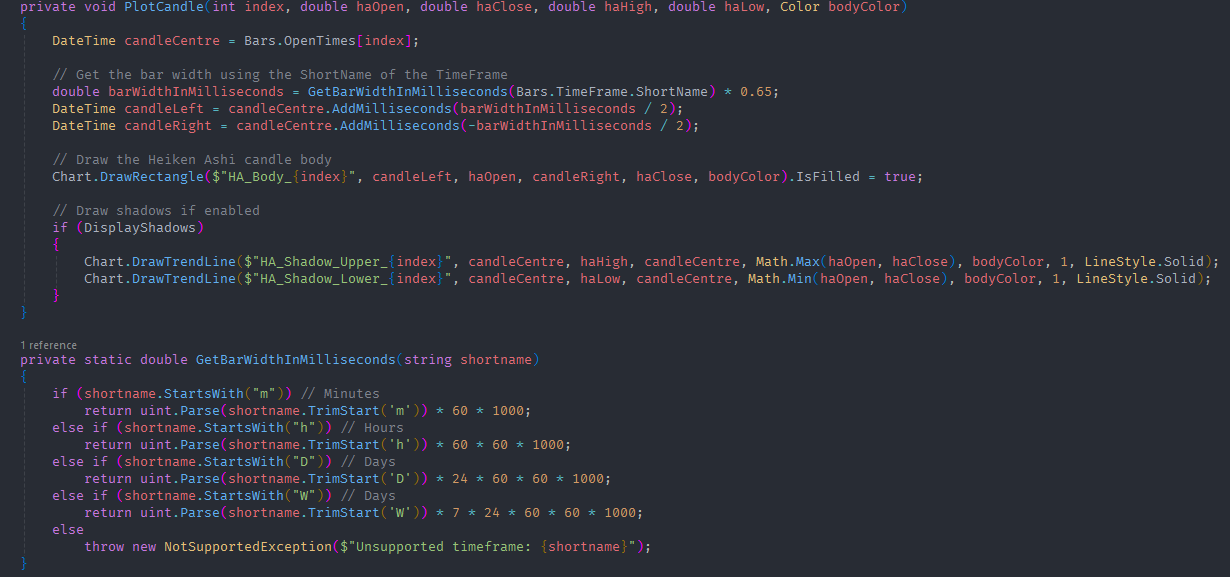
While it throws no errors or exceptions (currently!), and zooming out makes the problem less apparent, the output is making my OCD muscles twitch every time I notice it.
I'm hoping either Spotware or some other far more knowledgeable person than I, can point me in the right direction or tell me what I'm doing wrong!
Does the platform have some hardcoded limit of not drawing past Friday's market close on the chart at weekends (which regular candles have a special hall pass for)? Is my approach fundamentally flawed? Am I barking up the wrong tree? Is it just plain not possible? Is it some of the worst code you've seen? Do I need to get out more and stop staring at lines of code for hours? (Actually I think I know the answer to that last one! ;) )
Any help gratefully received!
Cheers,
Daren.
Replies
darengre
22 Jan 2025, 11:58
RE: Chart rendering issue
firemyst said:
Hi there:
Great job with the indicator! It's one I like to use as well.
As for your issue - don't draw a rectangle. Instead, make the rectangles a “trendline”. Same height, but use a thickness of 4 or 5 instead of 1 (to show the body). The width will expand equally in both directions.
Keep your “wicks” trendline exactly as they are.
So the “body” will be a thick trendline, which is how I did mine.
It'll be the easiest unless you want to do something fancier with the rectangles.
If you want to stick with the rectangles, try something along the lines of the following. I'm not sure if it will work, but worth trying:
                Rectangle r = Chart.DrawRectangle(...);
                r.HorizontalAlignment = HorizontalAlignment.Center;
Hi firemyst,
Firstly, thanks for your response and kind words, very much appreciated!
I do recall seeing somewhere on the forum someone suggesting using a trendline for their issue, and briefly looked at whether I could apply it in my code. The problem I found is that while you can of course specify a width for the line, even going way beyond the 4-5 (I think I tried 20+ at one point!), once the line is drawn it doesn't respect the chart zoom level, so basically you can tailor the width to display correctly at say 100% zoom, but whenever you adjust said zoom during analysis, “looking left” for key levels etc., the trendline bodies stay the same width meaning they'll either all merge together if you zoom out or become tiny in comparison to the regular candles they are overlaid upon.
These are using DrawTrendline with a width of 12, at 100%, 50% and 200% zoom:

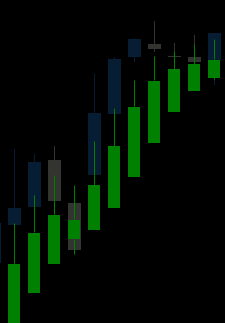
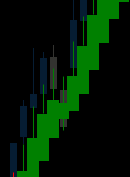
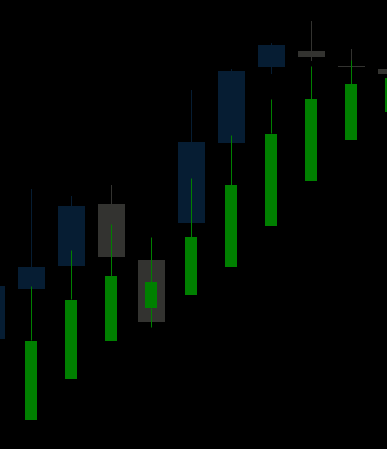
This is really why I ended up pursuing the rectangle method as I wanted the overlaid HA candles to match the size of the regular candles and behave the same as much as possible, regardless of the chart being dragged around, zoomed, etc.
So for me, while it definitely solved the “half candle on a Friday” issue, it sadly introduced other less desirable issues.
Moving on to trying your other suggestion (which had not occurred to me)!

I had to lose the “.IsFilled = true” property and add an explicit cast before VS2022 was happy and would compile it. This produced:
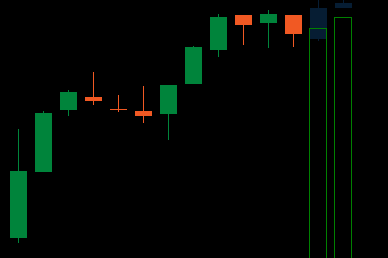
This kind of removed all historic HA candles (weird in and of itself considering one drawing line was changed, none of the logic), and also gave “hollow” rectangles (expected due to IsFilled being removed) for all new live candles, and weirdly decided to make all the new rectangles start from some place off the bottom of the chart - despite the correct values being available in that context (the line that works is just commented out above).
Experimenting a bit, trying various combinations of “r” assignments as shown below didn't solve any problems without introducing others:
(Note these are all just listed here to show what I tried, I obviously didn't have all the lines present and uncommented at the same time ;) )

Some combinations allowed the HorizontalAlignment, others allows the rectangles to be filled.
I am beginning to suspect that I may just have to live with the initial Friday weekend gap causing half candles due to platform limitations.
Thanks again!
@darengre

firemyst
20 Jan 2025, 00:31 ( Updated at: 21 Jan 2025, 21:08 )
Hi there:
Great job with the indicator! It's one I like to use as well.
As for your issue - don't draw a rectangle. Instead, make the rectangles a “trendline”. Same height, but use a thickness of 4 or 5 instead of 1 (to show the body). The width will expand equally in both directions.
Keep your “wicks” trendline exactly as they are.
So the “body” will be a thick trendline, which is how I did mine.
It'll be the easiest unless you want to do something fancier with the rectangles.
If you want to stick with the rectangles, try something along the lines of the following. I'm not sure if it will work, but worth trying:
@firemyst