Help!

Help!
22 Mar 2024, 20:48
Hi!
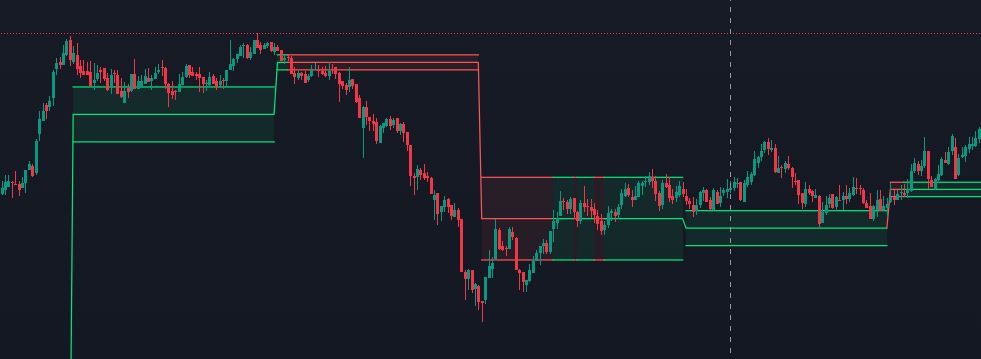
I'm noob in coding it took a lot of time for me to learn and code this simple “Central Pivot Range” indicator. I have been trying to change the color of pivot range if price moves above or below pivot line as in the image attached. Someone please help me if possible.
using System;
using cAlgo.API;
using cAlgo.API.Indicators;
using cAlgo.Indicators;
namespace cAlgo.indicator
{
[Indicator(IsOverlay = true, TimeZone = TimeZones.UTC, AccessRights = AccessRights.None)]
public class Pivotrange : Indicator
{
[Parameter("Time Frame", DefaultValue = "Daily")]
public TimeFrame TF { get; set; }
[Output("Pivot", LineColor = "7200FFFF", PlotType = PlotType.Line, LineStyle = LineStyle.LinesDots, Thickness = 1)]
public IndicatorDataSeries p { get; set; }
[Output("TC", LineColor = "7200FFFF", PlotType = PlotType.Line, LineStyle = LineStyle.LinesDots, Thickness = 1)]
public IndicatorDataSeries tc { get; set; }
[Output("BC", LineColor = "7200FFFF", PlotType = PlotType.Line, LineStyle = LineStyle.LinesDots, Thickness = 1)]
public IndicatorDataSeries bc { get; set; }
private Bars bars;
private int indexBase;
private IndicatorDataSeries High;
private IndicatorDataSeries Low;
private IndicatorDataSeries Open;
private IndicatorDataSeries Close;
protected override void Initialize()
{
bars = MarketData.GetBars(TF);
High = CreateDataSeries();
Low = CreateDataSeries();
Open = CreateDataSeries();
Close = CreateDataSeries();
}
public override void Calculate(int index)
{
indexBase = bars.OpenTimes.GetIndexByTime(Bars.OpenTimes.Last(1));
High[index] = bars.HighPrices[indexBase - 1];
Low[index] = bars.LowPrices[indexBase - 1];
Open[index] = bars.OpenPrices[indexBase - 1];
Close[index] = bars.ClosePrices[indexBase - 1];
p[index] = (High[index] + Low[index] + Close[index]) / 3.0;
bc[index] = (High[index] + Low[index]) / 2.0;
tc[index] = ((p[index] - bc[index]) + p[index]);
}
}
}
Replies
firemyst
24 Mar 2024, 08:01
Hi there:
You can't change the colors of “Output”s programmatically.
Instead, what you need to do is create another set of Outputs to represent the Lines that will be output when price rises above or below.
Assuming you want the line colors to change if price is above p[index] or below p[index] (as that's the only “pivot line” i see in your code).
So first, for the “tc” and “bc”, you need to make those plot types “DiscontinuousLine”
Next, create your new output objects. Ex:
[Output("TC2", LineColor = "Yellow", PlotType = PlotType.DiscontinuousLine, LineStyle = LineStyle.LinesDots, Thickness = 1)]
        public IndicatorDataSeries tc2 { get; set; }
        [Output("BC2", LineColor = "Cyan", PlotType = PlotType.DiscontinuousLine, LineStyle = LineStyle.LinesDots, Thickness = 1)]
        public IndicatorDataSeries bc2 { get; set; }
Then plot the values of each line accordingly:
p[index] = (High[index] + Low[index] + Close[index]) / 3.0;
//bc[index] = (High[index] + Low[index]) / 2.0;
//tc[index] = ((p[index] - bc[index]) + p[index]);

if (Close[index] > p[index])
{
    bc[index] = (High[index] + Low[index]) / 2.0;
    bc2[index] = double.Nan;
    tc[index] = double.Nan;
    tc2[index] = ((p[index] - bc[index]) + p[index]);
}
else if (Close[index] < p[index])
{
    bc2[index] = (High[index] + Low[index]) / 2.0;
    bc[index] = double.Nan;
    tc2[index] = double.Nan;
    tc[index] = ((p[index] - bc[index]) + p[index]);
}
else
{
    bc[index] = (High[index] + Low[index]) / 2.0;
    bc2[index] = double.Nan;
    tc2[index] = double.Nan;
    tc[index] = ((p[index] - bc[index]) + p[index]);
}
@firemyst
PanagiotisCharalampous
23 Mar 2024, 05:45
Hi there,
You need to ask specific questions to get specific answers. Leaving the code and waiting that somebody will finish the job for you will not get you much help as community members are busy with their own projects.
Best regards,
Panagiotis
@PanagiotisCharalampous