Find the mistake

Find the mistake
11 Sep 2014, 23:46
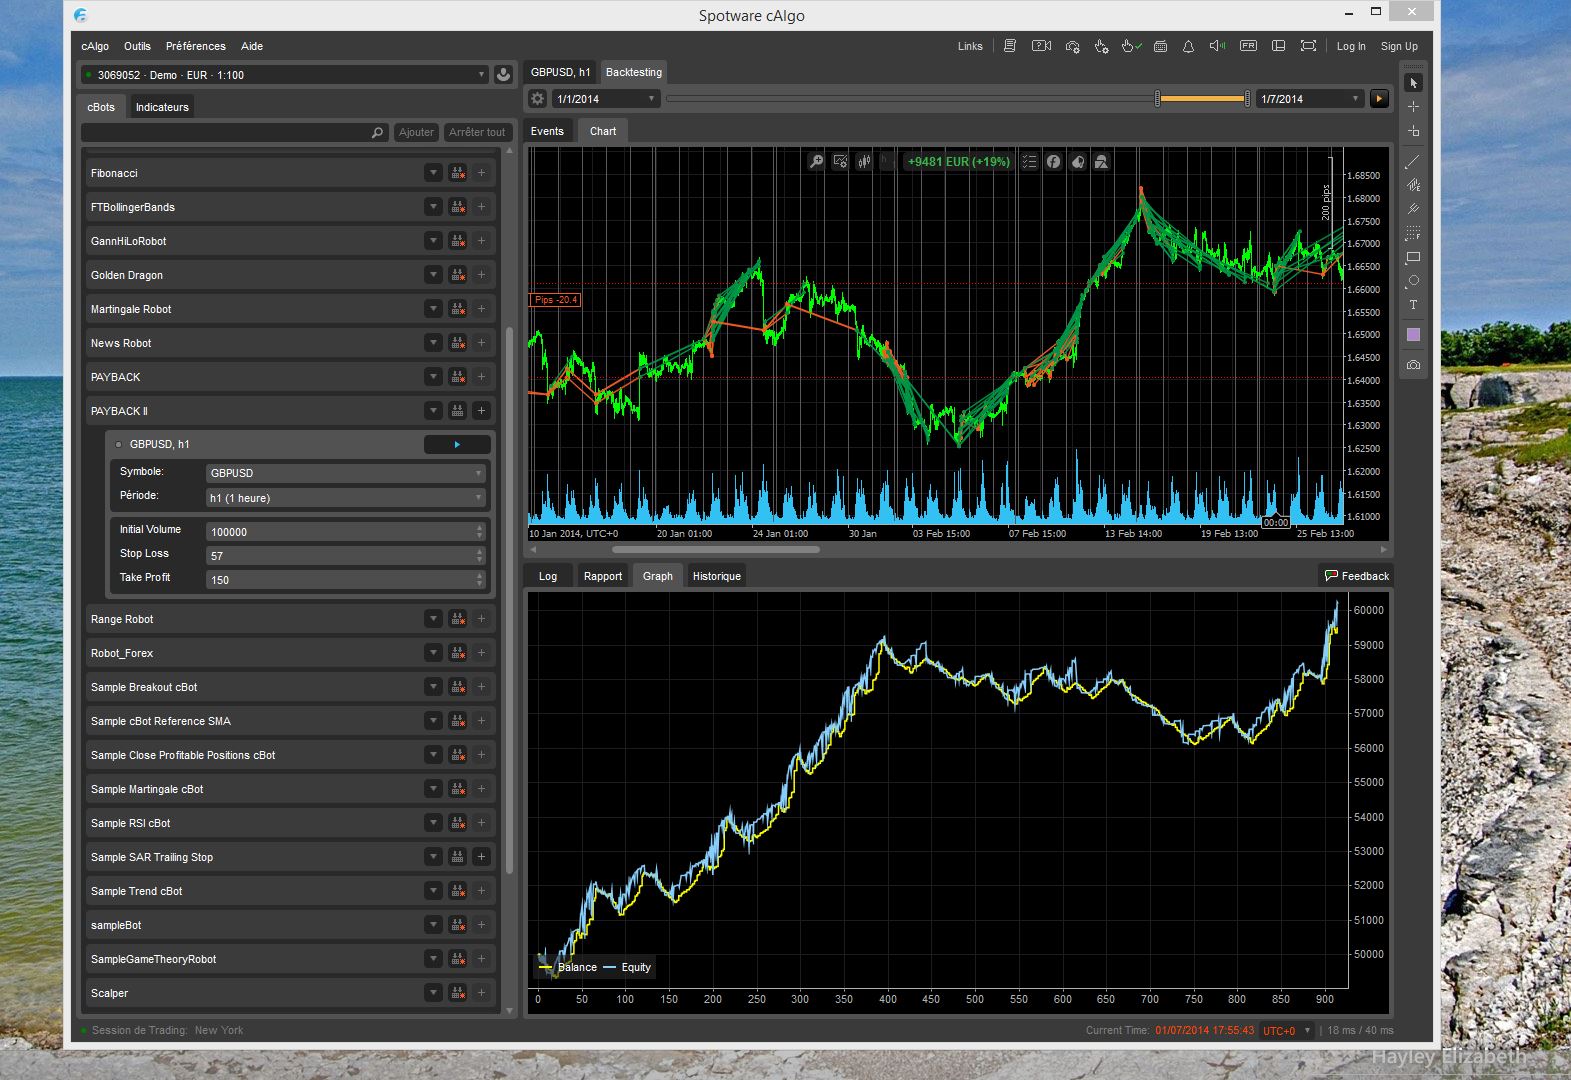
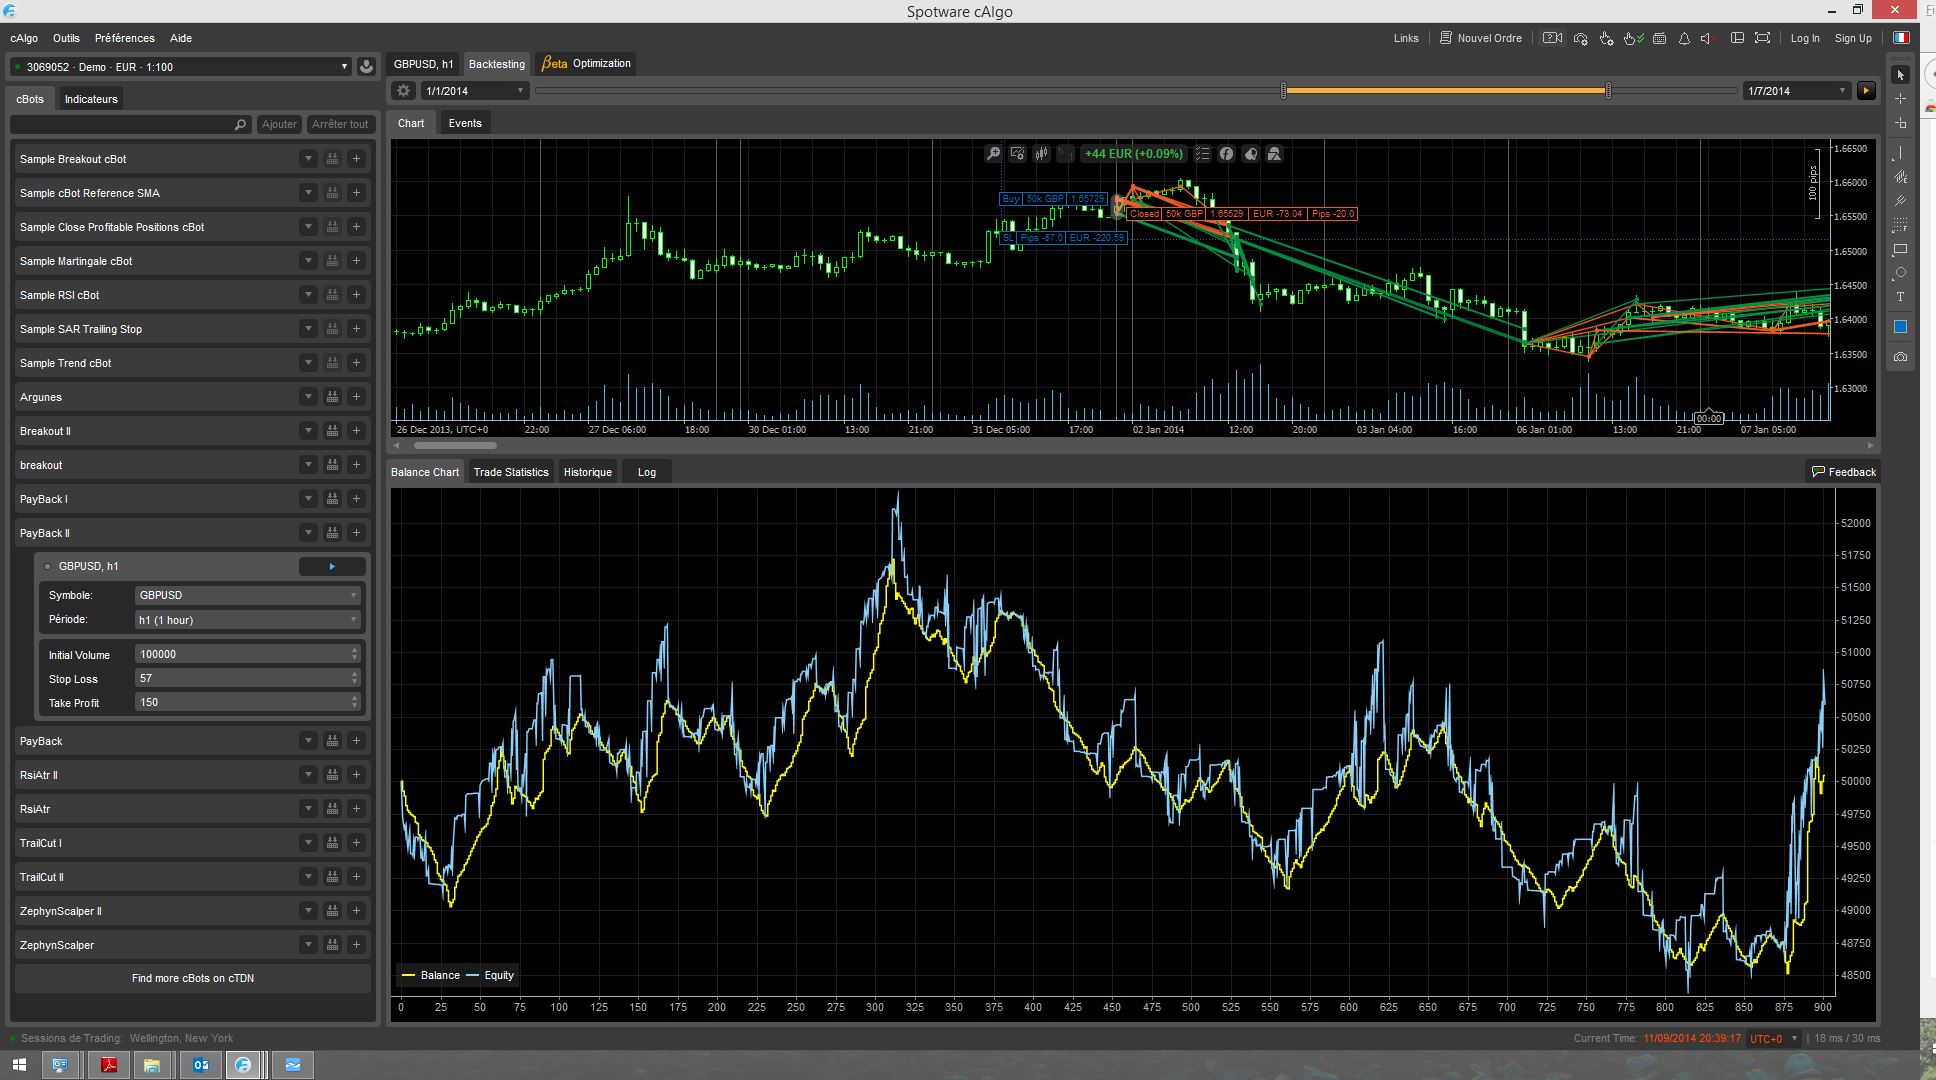
View the two graphics the first with the old bactesting progrm et the second with the new backtesting (mode tickdata). This is the same program and the same parameters.
Why they are so differents ?
The old :
The new :
Replies
jobenb
13 Sep 2014, 05:11
RE:
Abdallah_Hacid said:
In the first graphics (old cAlgo) I use the unique mode provide
In the second graph (new cAlgo with optimization) I use the tick mode.
I can think of a few reasons...
The new mode is more a true reflection of the market during this time, because the history contains more data points:
1. It now contains tick data instead of minute high, low, open and close.
2. It now also contains accurate spread data which you didn't have with the old data set (You could set the spread yourself and that can quickly give very misleading results if it is set as much lower than in real life i.e. 1pip instead of 10 for example)
Clearly you only had a tiny edge with the algorithm over the initial time tested and now with more accurate data it disappeared unfortunately and back to the drawing board. ;-)
@jobenb
Spotware
12 Sep 2014, 09:30
Please specify which data mode you use in each case.
@Spotware