LO
Indicator that draws horizontal lines
14 Nov 2020, 19:50
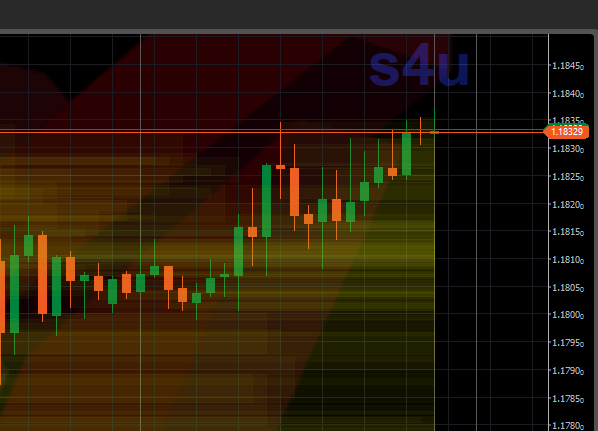
Is it possible to create an indicator, that draws horizontal lines?
I simply want to have an indicator that draws horizontal lines at the top and bottom wicks of each candle of the active timeframe (I know the chart will be saturated with lines)
The only parameters that I want to be able to change is line colour and thickness (and maybe date range?)
Is this possible to do? It seems simple but I cant seen to find a similar indicator
Thanks
Louis


Shares4us
15 Nov 2020, 13:01 ( Updated at: 21 Dec 2023, 09:22 )
RE:
Yep that's possible.
@Shares4us