Visual Studio Debugging issues

Visual Studio Debugging issues
26 Jul 2020, 15:04
Hi I am having problems with debugging cbots and indicators in Visual Studio 2017/2019. I hope someone can help me with my five questions below:
1) When using VS2019 I have followed the usual steps:
- Installed “cbots and indicators” extension in VS
- Closed VS
- In Automate, I attach EURUSD instance to “Sample Martingale cBot”. I also select the Backtesting tab.
- Select “Edit in Visual Studio”
- Make sure Debug mode is selected in VS
- In VS: Build > Rebuild Solution
- Place breakpoint at line 46 i.e. ExecuteOrder(InitialQuantity, GetRandomTradeType());
- In VS: Debug > “Attach to Process” > cTrader.exe
However, when I look in Automate, it has “Hot Reload unavailable”
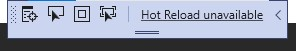
Is this still a problem in VS2019? How can I fix it?
2) When using VS2017, the above steps however work. I then press the Backtesting play button, and it stops at the breakpoint on line 46. However, when I try and step into the ExecuteOrder() method by pressing F11, it just runs to completion. Even if I place breakpoints on lines 51 and 52 which are in ExecuteOrder() it never is able to reach those breakpoints. Why is this so?
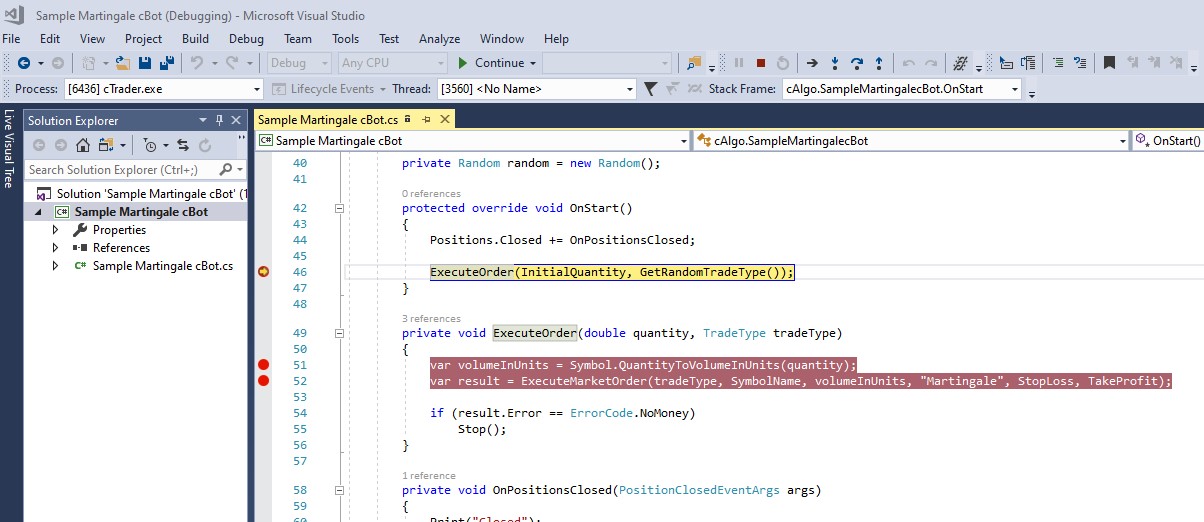
3) Aside from the issue with 2). If I place a number of breakpoints elsewhere in the code, when I press either ‘Step Into’ or ‘Step over’ i.e. F11/F12, it will only stop at the next breakpoint. It never stops at intermediate code between breakpoints. I don’t understand. F11/F12 should step line by line, not breakpoint by breakpoint.
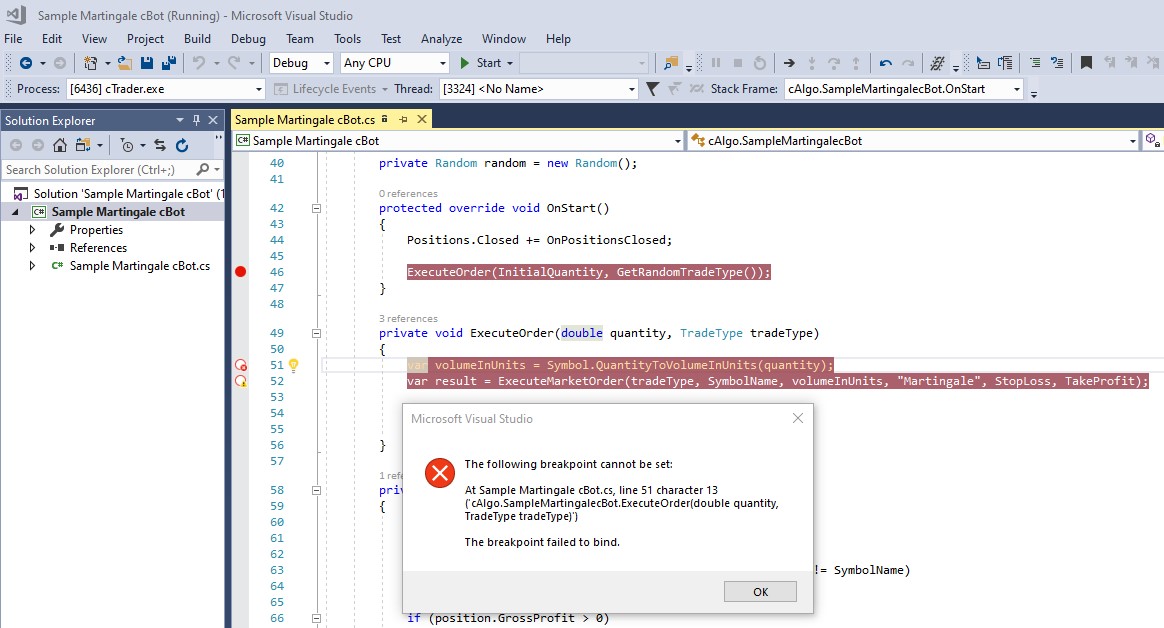
4) Sometimes when I restart a backtest, i.e. stop debugging in VS, then select Debug > “Attach to Process” > cTrader.exe, I get a “The following breakpoint cannot be set” error, on a breakpoint that was previously selectable. For example, I was previously able to select breakpoints at lines 51 and 52 (as seen in my Q2 above - even though those breakpoints never worked in the first place), but not when i do a rerun. Why? Maybe I am getting this error because the breakpoints don't actually work (from q2)?
5) I am trying to watch the returned value from GetRandomTradeType() method on line 76. I added some code to place it into a variable before it is returned. However, I cannot watch the variable as it tells me "Cannot obtain value of the local variable or argument because it is not available at this instruction pointer, possibly because it has been optimized away."
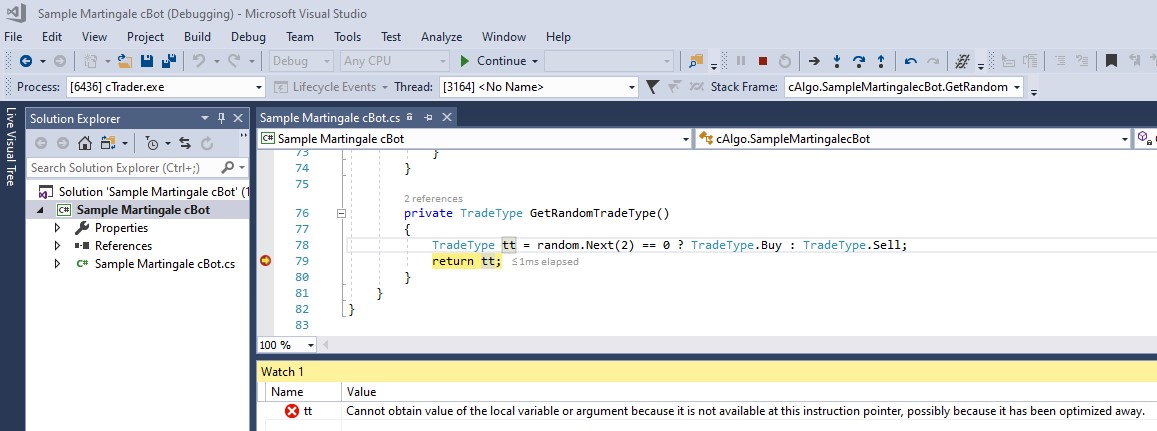
Would anyone know how to fix this?
Thanks for any help with the above issues. Any help would be fantastic.
Kelly
Replies
BigManDave
23 Jan 2022, 04:00
RE:
BigManDave said:
Did you manage to fix these? I'm also having problems debugging, and cannot see values of local variables when debugging, and it's very annoying.
Okay, I managed to fix #5 by following this stackoverflow answer
@BigManDave
BigManDave
23 Jan 2022, 03:55
Did you manage to fix these? I'm also having problems debugging, and cannot see values of local variables when debugging, and it's very annoying.
@BigManDave