Optimization of statistic curve

Optimization of statistic curve
22 Feb 2019, 15:22
•Hi there...
• I would like to know if anybody have a suggestion to a algorithm about curve, I will explain in details, please look the shot print.
•The robot use the curve black with 3 periods, this because I want the reference the last 3 hours, but, I would like to use the curve red (14 periods) but considering only the last 3 hours over the red curve.
•The reason is because the red curve have a correct information of the direction of investiment. If I use the 14 periods in the formula (or 14 last hours) the information is wrong. The correct is only the last 3 hours but over the red curve.
•Anybody have a suggestion?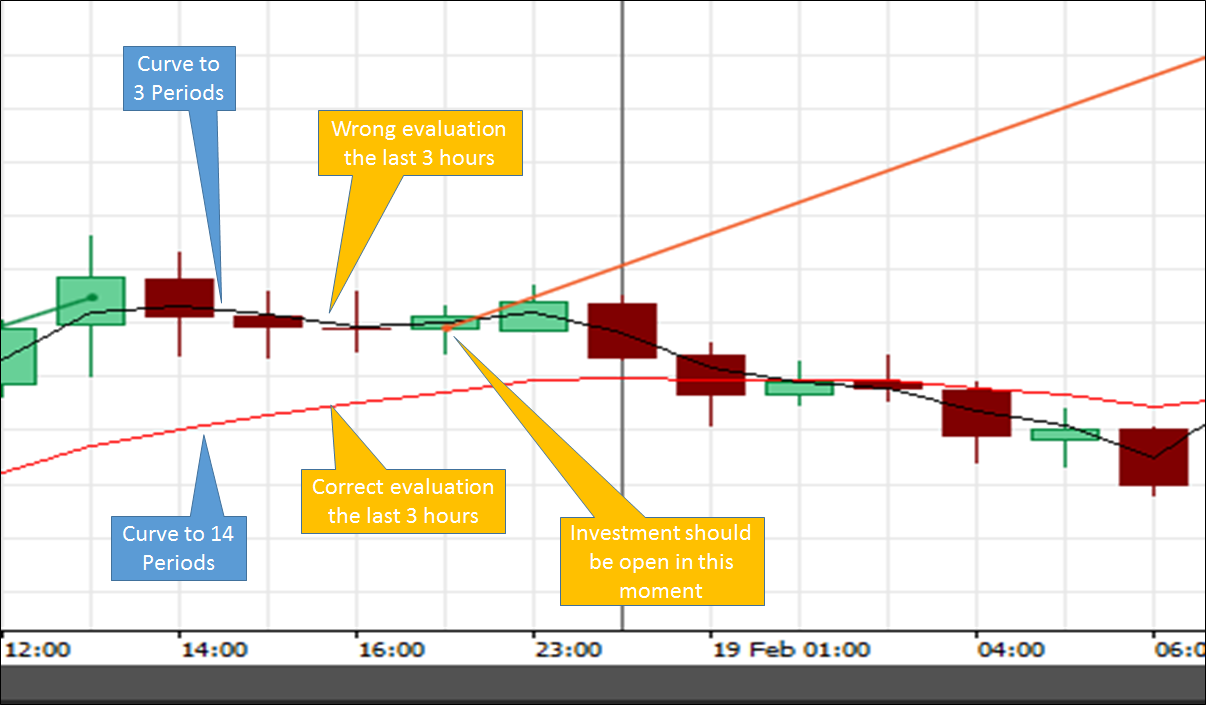
•tks
Replies
eliezer_barros
22 Feb 2019, 18:53
RE:
Panagiotis Charalampous said:
Hi Eliezer,
My understanding is that you want a trade to open when the 14 period MA is rising for the last 3 bars. Is that correct?
Best Regards,
Panagiotis
hi...
Yes, you are correct.
@eliezer_barros
lec0456
23 Feb 2019, 03:18
I am not sure I understnd you but, it sounds like you just want to create a slope indicator, that will subtract the current 14 prd moving average from the previous one. Then you feed that indicator into a cBot and make a trade when the last 3 prds are positive or negative. Here is an example of a slope indicator.
using System;
using cAlgo.API;
using cAlgo.API.Indicators;

namespace cAlgo.Indicators
{
    [Indicator(IsOverlay = false)]
    public class myMASlope : Indicator
    {
        [Parameter(DefaultValue = 60)]
        public int paramPeriods { get; set; }
        [Parameter(DefaultValue = 1.9)]
        public double paramLimit { get; set; }

        [Output("MA Slope", PlotType = PlotType.Histogram, Thickness = 2, Color = Colors.Purple)]
        public IndicatorDataSeries Result { get; set; }
        [Output("SlopeMA", LineStyle = LineStyle.Lines, Color = Colors.Red)]
        public IndicatorDataSeries SlopeMA { get; set; }

        [Output("UpperLimit", PlotType = PlotType.Line, LineStyle = LineStyle.DotsRare, Thickness = 1, Color = Colors.Red)]
        public IndicatorDataSeries UpperLimit { get; set; }
        [Output("LowerLimit", PlotType = PlotType.Line, LineStyle = LineStyle.DotsRare, Thickness = 1, Color = Colors.Red)]
        public IndicatorDataSeries LowerLimit { get; set; }
        [Output("Center", LineStyle = LineStyle.DotsRare, Color = Colors.White)]
        public IndicatorDataSeries CenterLine { get; set; }

        private SimpleMovingAverage sma;
        private MovingAverage slopema;
        private SimpleMovingAverage slopema2;

        protected override void Initialize()
        {
            sma = Indicators.SimpleMovingAverage(MarketSeries.Close, paramPeriods);
            slopema = Indicators.MovingAverage(Result, 2, MovingAverageType.Exponential);
            slopema2 = Indicators.SimpleMovingAverage(slopema.Result, 2);
        }

        public override void Calculate(int index)
        {
            int t0 = index;
            int t1 = t0 - 1;
            int t2 = t1 - 1;

            if (t1 < 0)  return;

            if (double.IsNaN(sma.Result[t1])) return;

            Result[index] = Math.Round((sma.Result[t0] - sma.Result[t1]) / (Symbol.PointSize), 2);
            SlopeMA[index] = slopema2.Result[index];
            //Result[index]= Math.Round((sma.Result[t0]-sma.Result[t2])/(Symbol.PointSize*2),2);
            UpperLimit[index] = paramLimit;
            LowerLimit[index] = -paramLimit;
            CenterLine[index] = 0;
        }
    }
}
@lec0456
eliezer_barros
25 Feb 2019, 14:47
( Updated at: 21 Dec 2023, 09:21 )
RE:
lec0456 said:
I am not sure I understnd you but, it sounds like you just want to create a slope indicator, that will subtract the current 14 prd moving average from the previous one. Then you feed that indicator into a cBot and make a trade when the last 3 prds are positive or negative. Here is an example of a slope indicator.
using System;
using cAlgo.API;
using cAlgo.API.Indicators;

namespace cAlgo.Indicators
{
    [Indicator(IsOverlay = false)]
    public class myMASlope : Indicator
    {
        [Parameter(DefaultValue = 60)]
        public int paramPeriods { get; set; }
        [Parameter(DefaultValue = 1.9)]
        public double paramLimit { get; set; }

        [Output("MA Slope", PlotType = PlotType.Histogram, Thickness = 2, Color = Colors.Purple)]
        public IndicatorDataSeries Result { get; set; }
        [Output("SlopeMA", LineStyle = LineStyle.Lines, Color = Colors.Red)]
        public IndicatorDataSeries SlopeMA { get; set; }

        [Output("UpperLimit", PlotType = PlotType.Line, LineStyle = LineStyle.DotsRare, Thickness = 1, Color = Colors.Red)]
        public IndicatorDataSeries UpperLimit { get; set; }
        [Output("LowerLimit", PlotType = PlotType.Line, LineStyle = LineStyle.DotsRare, Thickness = 1, Color = Colors.Red)]
        public IndicatorDataSeries LowerLimit { get; set; }
        [Output("Center", LineStyle = LineStyle.DotsRare, Color = Colors.White)]
        public IndicatorDataSeries CenterLine { get; set; }

        private SimpleMovingAverage sma;
        private MovingAverage slopema;
        private SimpleMovingAverage slopema2;

        protected override void Initialize()
        {
            sma = Indicators.SimpleMovingAverage(MarketSeries.Close, paramPeriods);
            slopema = Indicators.MovingAverage(Result, 2, MovingAverageType.Exponential);
            slopema2 = Indicators.SimpleMovingAverage(slopema.Result, 2);
        }

        public override void Calculate(int index)
        {
            int t0 = index;
            int t1 = t0 - 1;
            int t2 = t1 - 1;

            if (t1 < 0)  return;

            if (double.IsNaN(sma.Result[t1])) return;

            Result[index] = Math.Round((sma.Result[t0] - sma.Result[t1]) / (Symbol.PointSize), 2);
            SlopeMA[index] = slopema2.Result[index];
            //Result[index]= Math.Round((sma.Result[t0]-sma.Result[t2])/(Symbol.PointSize*2),2);
            UpperLimit[index] = paramLimit;
            LowerLimit[index] = -paramLimit;
            CenterLine[index] = 0;
        }
    }
}
Hi, thank for your suggestions, yes I want to use the curve with 14 prd and use only the last 3 or 4 hours to open the position according with direction. If I use the curve with 3 or 4 periods, in really the curve is other and the directions can be wrong.
I am do not a specialist in this kind of program and I went to do a test in system and found some errors that I will print here, if you can modify I will thanks to you again.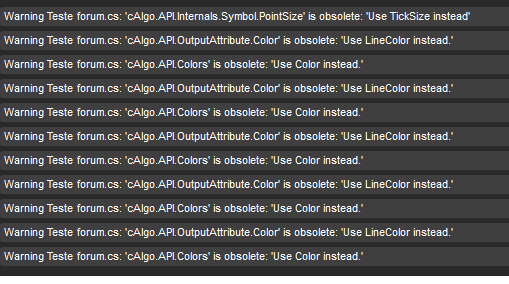
@eliezer_barros
PanagiotisCharalampous
28 Feb 2019, 12:28
Hi Eliezer,
1. If you want to check the trend of the 14 period during the last 3 periods, you can just compare the last value with the value 3 periods before. See below an example
if(sma.Result.LastValue > sma.Result.Last(3)
{
    //Do something for bullish sma
}
2. Regarding the warnings, just replace the Color property with LineColor e.g. Color = Colors.Red should become LineColor = "Red"
Best Regards,
Panagiotis
@PanagiotisCharalampous
PanagiotisCharalampous
22 Feb 2019, 17:33
Hi Eliezer,
My understanding is that you want a trade to open when the 14 period MA is rising for the last 3 bars. Is that correct?
Best Regards,
Panagiotis
@PanagiotisCharalampous