cTrader 3.0 - Debugging (PDB files)

cTrader 3.0 - Debugging (PDB files)
01 May 2018, 20:40
Hi Spotware,
My breakpoints can't be hit because there are no PDB files loaded to Visual Studio 2017. Can you tell me where can I find them or give me a hint how to debug cBots in VS 2017 and cTrader 3.0?
Regards
MaRCHeW
Replies
ClickAlgo
06 May 2018, 11:13
Hi MarCHeW,
Debugging using Visual Studio 2015 or 2017 does work with cTrader, take a look at the link below which also has a video showing you how to do this, make sure your build configuration is set to Debug and not Release, if you still have an issue it will be the Visual Studio IDE and not the trading platform.
https://clickalgo.com/how-to-debug-ctrader-algo-visual-studio
Paul Hayes
Sales & Marketing
Email: contact@clickalgo.com
Phone: (44) 203 289 6573
Website: https://clickalgo.com

@ClickAlgo
MaRCHeW
06 May 2018, 13:57
RE:
Hi Paul,
Thanks for your response, but as you know cAlgo is build-in cTrader 3.0 and you can attach only to this process.
Moreover "Debug" is default option used by VS during compilation and I didn't change it to "Release" mode.
To Spotware,
I've fixed problem and debugging is working now on both VS2015 and VS2017.
Regards
MaRCHeW
Paul_Hayes said:
Hi MarCHeW,
Debugging using Visual Studio 2015 or 2017 does work with cTrader, take a look at the link below which also has a video showing you how to do this, make sure your build configuration is set to Debug and not Release, if you still have an issue it will be the Visual Studio IDE and not the trading platform.
https://clickalgo.com/how-to-debug-ctrader-algo-visual-studio
Paul Hayes
Sales & Marketing
Email: contact@clickalgo.com
Phone: (44) 203 289 6573
Website: https://clickalgo.com
@MaRCHeW
acrigney
04 Jun 2018, 03:51
No symbols loaded for cTrader 3.0
Please help!
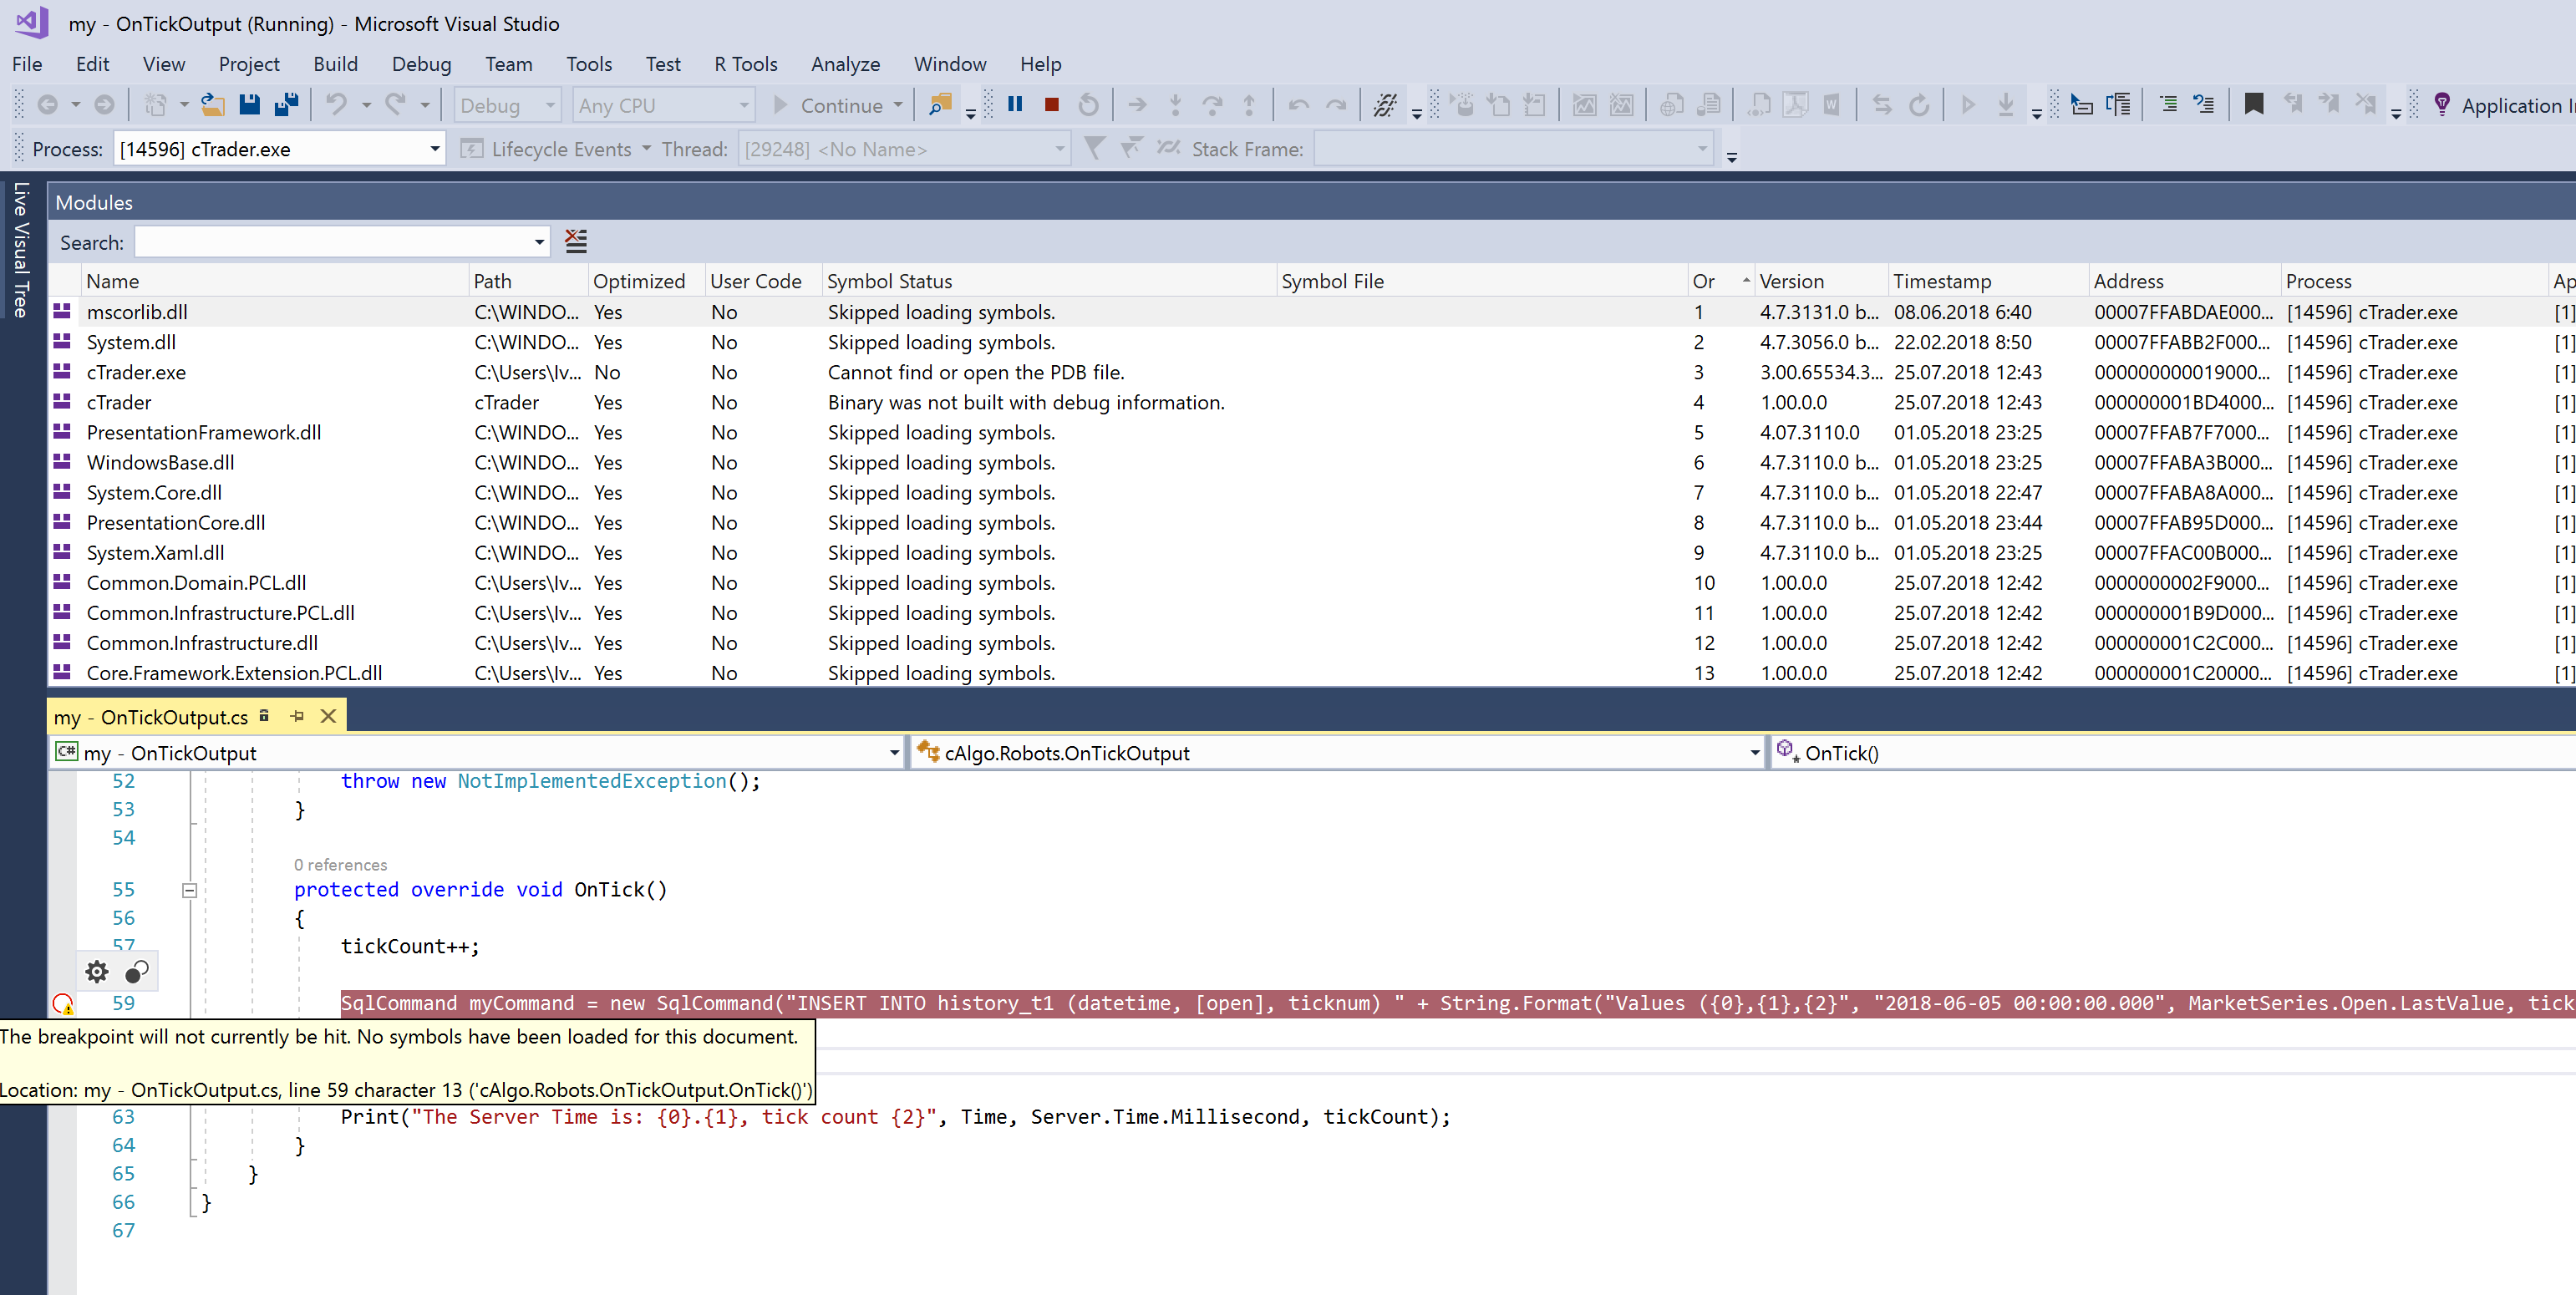
I have installed the latest cBots from the visual studio market place but I am unable to debug my cbots, I get No symbols loaded.
I created a new cBot and I am still unable to set a break point in the OnStart() event or OnBar events
I tried all of these options.
But there are no pdb files generated in the bin folder of the project, the name.algo file gets generated in the Robots folder ok.
Best Regards,
Alistair
@acrigney
ClickAlgo
04 Jun 2018, 08:53
Hi Alistair,
This is a Microsoft Visual Studio problem, you would be better off posting on StackOverflow.
But first, make sure that you have set the solution configuration to debug and not release.
Paul Hayes
Sales & Marketing
Email: contact@clickalgo.com
Phone: (44) 203 289 6573
Website: https://clickalgo.com
@ClickAlgo
PanagiotisCharalampous
08 Aug 2018, 10:39
Hi robotic,
.pdb files are not needed. What you debug is the cBot and not cTrader. If you follow the instructions you should have no problem setting breakpoints.
Best Regards,
Panagiotis
@PanagiotisCharalampous
gonzsanc
27 Sep 2019, 11:44
Hi.
The problem with the symbols is because you start debugging in the wrong way.
The steps are the following ones:
- Check that your indicator or bot IS NOT RUNNING on Ctrader. If it is on any of the open charts, then unload it.
- Select Edit in Visual Studio as explained in the instructions.
- Once Visual Studio is opened, switch to Debug mode as explained and COMPILE.
- After successfully compiling, set your breakpoints. And NOW the thing becomes interesting...
- Go to Debug > Attach to process and attach as explained to Ctrader.exe (this is written in 2019, so if you read this years later, then check if the process has another name then).
- Now you can see that the symbols are not loaded, why? Because YOU ARE NOT RUNNING the indicator/bot on Ctrader.
- Switch to your Ctrader application and load your indicator/bot on any of the charts.
- Now the indicator is running on Ctrader and when it reaches your breakpoint, you will be able to see the stack and all the other stuff.
Therefore, THE MAIN PROBLEM is that when debugging we have forgotten that we need to also start running our bot/indicator with Ctrader itself after we attach the process on VS.
@gonzsanc
testyk
09 Sep 2020, 16:12
( Updated at: 21 Dec 2023, 09:22 )
Hi,
I'm using cTrader 3.8 VS 2019 on Windows 10.
My issue was that the debugger was stopping on a breakpoint, but I couldn't StepOver or StepInto.
I resolved the issue by selecting "Enable .Net Framework source stepping" and "Suppress JIT optimization on module load(Managed only)" under Debug->Options->Debugging->General
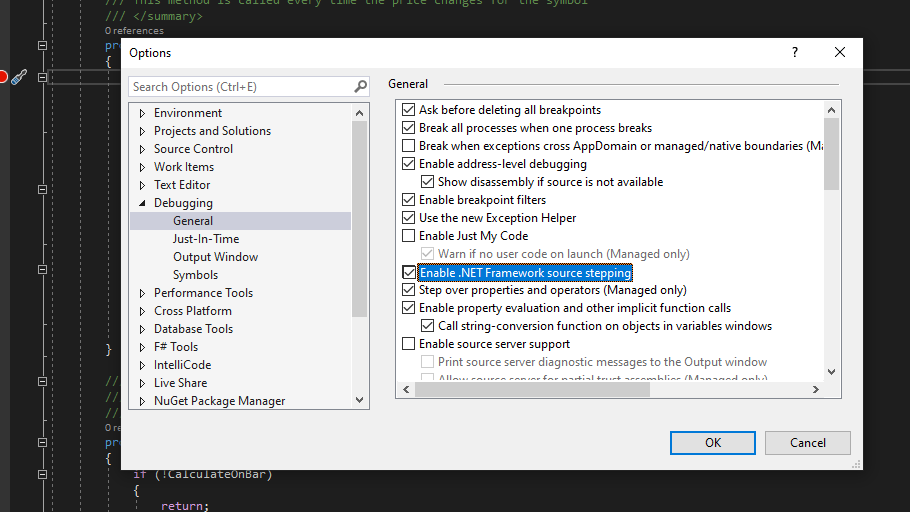
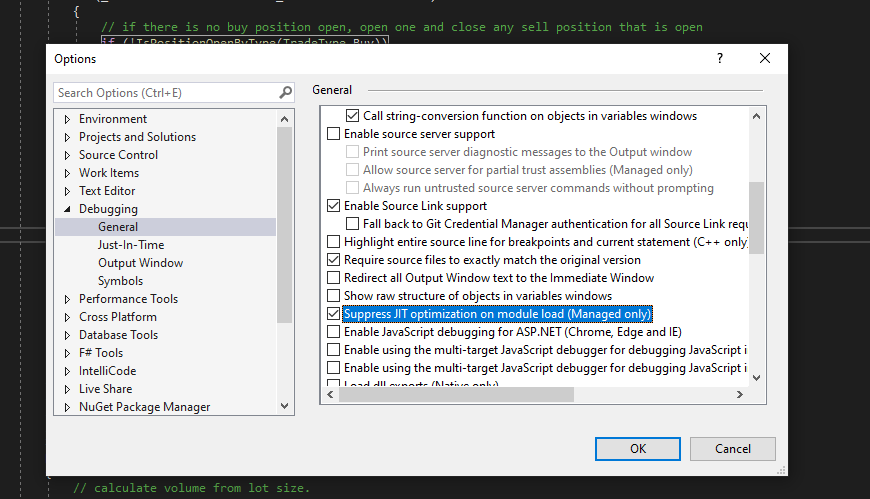
Next, Clean and Build the solution in Debug mode and stepping through the code works as expected
@testyk
MaRCHeW
03 May 2018, 19:55
Hi,
I'd like to notice that the debugging doesn't work for cAlgo 2.01 (Pepperstone).
Please confirm this issue.
Regards
MaRCHeW
@MaRCHeW