How to Plot High Low Lines for last N periods
27 May 2020, 08:18
Hi,
I want to plot lines for last N periods High and Low. I can get values of High and Low like below.
double hh = Bars.HighPrices.Maximum(10);
double ll = Bars.LowPrices.Minimum(10);
From here, I can use ChartObjects to plot lines. I got how to plot High and Low of a day. But, its not working when I modified. I am not sure how to code it. Kindly provide any code snippet.
Thanks
R C Vamsi Vardhan
Replies
vamsi.rc
27 May 2020, 09:18
( Updated at: 21 Dec 2023, 09:22 )
RE:
Let me explain more
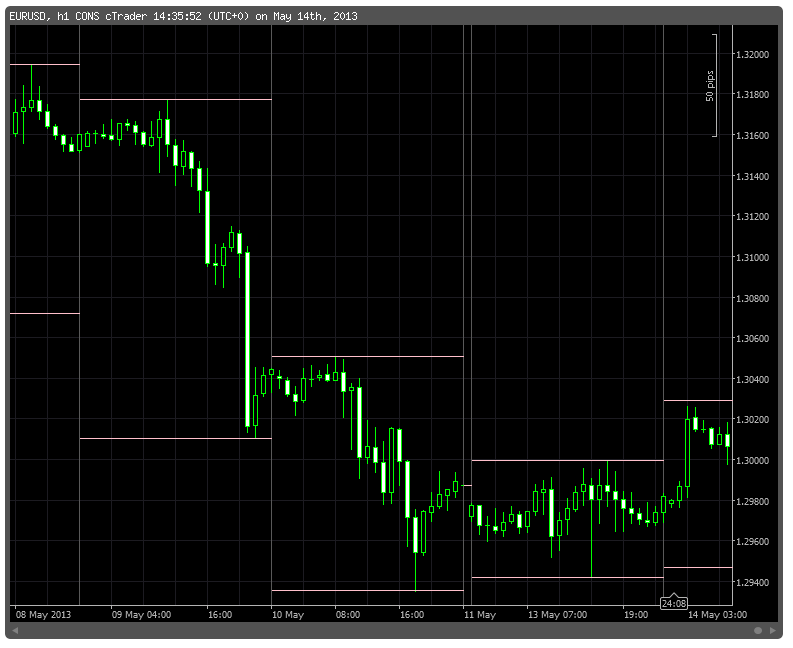
I want to plot Horizontal Lines for High and Low of last N Periods. I got the code snippet from below.

I want to plot lines like this. Above screenshot is for Daily High and Low.
using System;
using cAlgo.API;

namespace cAlgo.Indicators
{
    [Indicator(IsOverlay = true)]
    public class DailyHighLow : Indicator
    {
        public override void Calculate(int index)
        {
            DateTime today = MarketSeries.OpenTime[index].Date;
            DateTime tomorrow = today.AddDays(1);

            double high = MarketSeries.High.LastValue;
            double low = MarketSeries.Low.LastValue;

            for (int i = MarketSeries.Close.Count - 1; i > 0; i--)
            {
                if (MarketSeries.OpenTime[i].Date < today)
                    break;

                high = Math.Max(high, MarketSeries.High[i]);
                low = Math.Min(low, MarketSeries.Low[i]);
            }

            ChartObjects.DrawLine("high " + today, today, high, tomorrow, high, Colors.Pink);
            ChartObjects.DrawLine("low " + today, today, low, tomorrow, low, Colors.Pink);
        }
    }
}
This is the code for above screenshot. But I want to plot High and Low for last 10 periods.
PanagiotisCharalampous said:
Hi Vamsi,
It is not clear what you are asking for. What lines do you want to plot? Could you post an example? What did you modify, what does it do and what should it be doing instead? What should this snippet do?
Best Regards,
Panagiotis
@vamsi.rc
PanagiotisCharalampous
27 May 2020, 09:31
Hi Vamsi,
See below an example
using System;
using cAlgo.API;

namespace cAlgo.Indicators
{
    [Indicator(IsOverlay = true)]
    public class DailyHighLow : Indicator
    {
        public override void Calculate(int index)
        {
            if (IsLastBar)
            {
                double high = MarketSeries.High.Maximum(10);
                double low = MarketSeries.Low.Minimum(10);

                ChartObjects.DrawLine("high ", Bars.OpenTimes[index - 10], high, Bars.OpenTimes[index], high, Colors.Pink);
                ChartObjects.DrawLine("low ", Bars.OpenTimes[index - 10], low, Bars.OpenTimes[index], low, Colors.Pink);
            }
        }
    }
}
Best Regards,
Panagiotis
@PanagiotisCharalampous

PanagiotisCharalampous
27 May 2020, 08:46
Hi Vamsi,
It is not clear what you are asking for. What lines do you want to plot? Could you post an example? What did you modify, what does it do and what should it be doing instead? What should this snippet do?
Best Regards,
Panagiotis
Join us on Telegram
@PanagiotisCharalampous