Tick volume


Tick volume
26 Nov 2013, 13:55
I try to get a profound understanding of the Volume concept, that as i'm told is the same as Tock Count of Tick Volume.
What exactly does it tell us?
Say, if a certain candle stick shows a Volume in the bottom of the charts of 20 and the candle next to it has a volume of 10. What does that mean? Were there twice as many trades on that candle, or dit the candle move faster or more pips up- or downwards?
Please explain to me, because i'v had three explenations so far and all three are different.
Replies
jeex
02 Dec 2013, 23:17
( Updated at: 21 Dec 2023, 09:20 )
New tiny indicator
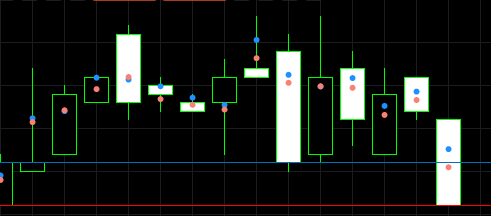
In that case I just made a new very tiny indicator. I don't know yet how significant this can be in candle analyses (or price action analyses), but it tells us where the weight of all the ticks within one candle is. Maybe it's completely usesless, but this is information that is not shown in a single Japanese candle.
So where in the candle dit most of the ticks take place and how balanced are Ask and Bid ticks? See the image below. The dots are based on the simple average of all the ticks, but could also be based on the weighed or exponential average.
In a way it shows the resume of the smaller time frames within the candle. If dots are far apart, there was more turmoil. If dots are on the Open-side of the candle, then prize chanched recently towards Close. You could use these dots as a dimmer for the OnTick method, so one extreme tick will not be enough to open or close a trade for example.
@jeex
Spotware
03 Dec 2013, 10:17
RE: Forum request
jeex said:
... and it would be nice if you could edit your posts on this forum, as i see a lot of typing errrrrs in my above post. My apologies for that.
Yes, you are right. We will include editing of the posts. For the time being, you may use the spell-checker and preview your post prior to submitting it.
@Spotware
jeex
03 Dec 2013, 14:06
Candle data: Ask, Bid or both?
Spotware said:
Yes, you are right. We will include editing of the posts. For the time being, you may use the spell-checker and preview your post prior to submitting it.
LOL. Thanks. Installed English in my browser, hope it works.
Q: is the candle made of the Bid price, the Ask price or a combi?
@jeex
Balena
04 Dec 2013, 06:09
RE: Thanks and ready it is
jeex said:
Spotware said:
The candle is made of the Bid price.
Thanks for the quick response. In that case my indicator is ready. Don't know what it's good for, but it does show information that used to be hidden in the candle. I'll upload it somewhere.
would be better to see where the most volume was executed within the candle vs the price change... and if it was executed at the bid or ask... price changes can be spoofed by HFT strategies and conclusions without careful considerations could be the direct opposite of common logic
@Balena
fzlogic
28 Nov 2013, 17:24
Tick volume is number of trades.
@fzlogic