Problem with ChartObjects.DrawLine
Created at 11 Aug 2018, 21:03


Problem with ChartObjects.DrawLine
11 Aug 2018, 21:03
Hi,
I have a cBot that draws me a line in the chart where this line corresponds to a different value per candle, it happens that in ChartObjects.DrawLine it only draws the line between the initial value and the final value. As you can see in the chart on the left, but my goal is to draw as in the chart on the right.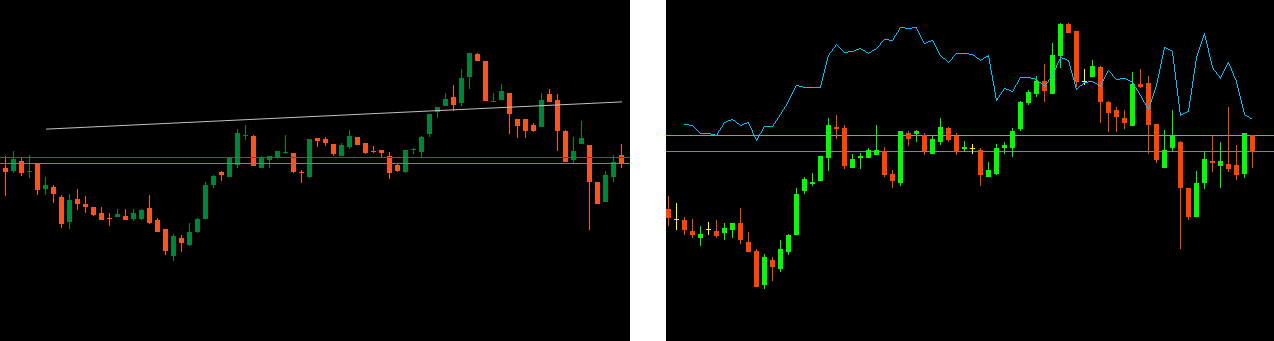 Here is the code below, could anyone help me?
Thank you in advance and I apologize for the lack of quality in my English.
            PeriodRange = 72:
            double[] newClose_Sub = new double[PeriodRange + 1];
            for (int i = 1; i < PeriodRange; i++)
            {
                newClose_Sub[i] = Math.Round(MainRangeCenter + Math.Round(SubSymbolGetSeries.Close.Last(i) - SubRangeCenter, 5) * PipsRatio, 5);
                DateTime StartOfLineSubSymbol = SubSymbolGetSeries.OpenTime.Last(i);
                DateTime EndOfLineSubSymbol = SubSymbolGetSeries.OpenTime.Last(0);

                //Desenha linhas
                ChartObjects.DrawLine("LabelCloseSub", StartOfLineSubSymbol, newClose_Sub[i], EndOfLineSubSymbol, Close_Sub, Colors.Silver);
            }
PanagiotisCharalampous
13 Aug 2018, 09:52
Hi DelTrader,
Can you please post a complete cBot code?
Best Regards,
Panagiotis
@PanagiotisCharalampous