Strategy results analyzer - beta version


Strategy results analyzer - beta version
06 Aug 2013, 01:09
Glad to present new tool for traders and algo-developers. The idea is to analyze results of backtesting or live trading strategy using different visualizatons, charts and statistics. For now only few charts available but the plan is to present a lot.
Beta testers are welcome at www.algochart.com, you feedback is needed (post to this thread or send to info@algochart.com ).
How to use:
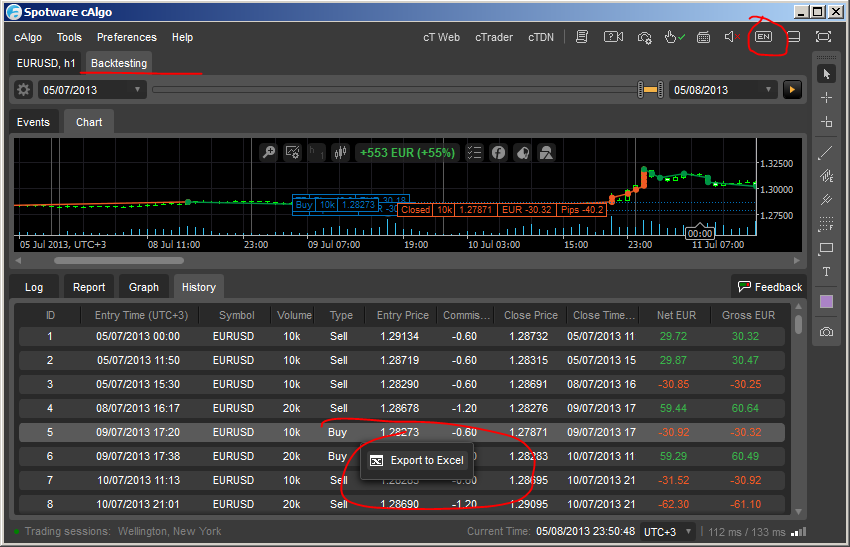
1. Export backtesting or trading account results to Excel.
Important! cTrader / cAlgo must be switched to English language. Major columns in the grid must not be hidden.
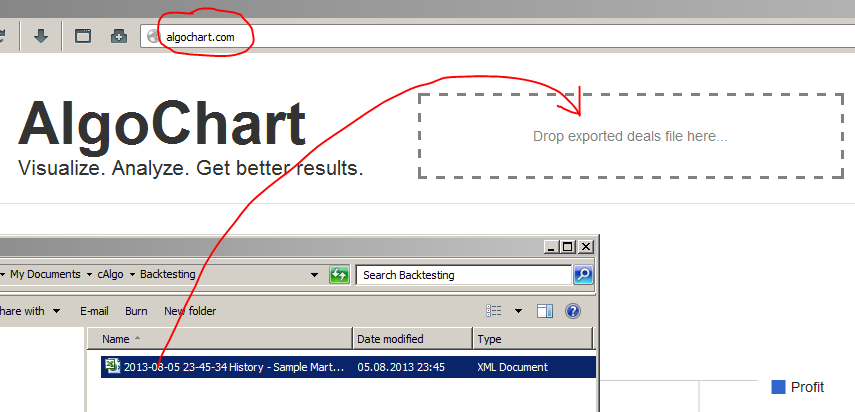
2. Drag-and-Drop exported file to the upload zone on the website.
3. Get the charts!
Replies
algoforce
08 Aug 2013, 13:34
Well Done. This is very nice. I'm looking forward to using this from now on. When I use it, I will contribute to suggestions.
@algoforce
Researcher
10 Aug 2013, 02:57
( Updated at: 21 Dec 2023, 09:20 )
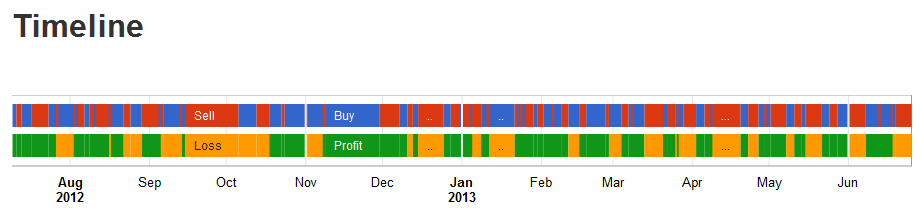
New super-cool timeline feature is just released on algochart.com. Please test it.
Single-symbol:
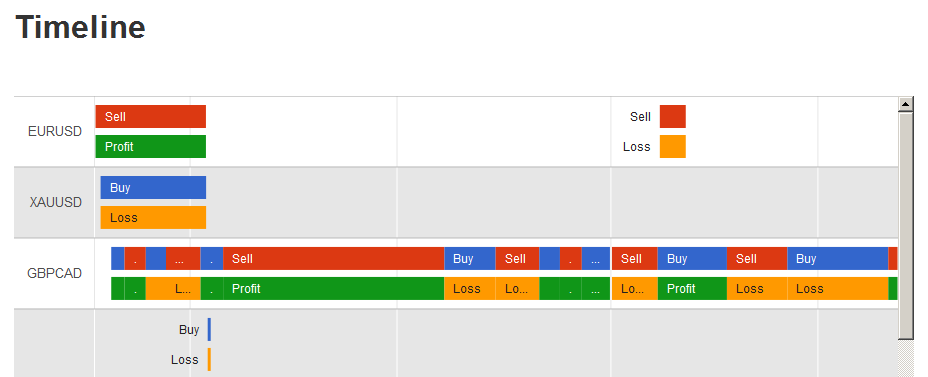
Multi-symbol:
@Researcher
Researcher
10 Aug 2013, 22:56
For now it's only Entry Time, Close Time, Net Profit, Type (buy/sell). Symbol can be used in multi-symbol timeline, but for now this column is optional. If you miss some column the site will show appropriate error.
@Researcher
AlexanderRC
04 Feb 2014, 20:05
Resercher, would you be so kind to share you code for the charts?
Maybe on GitHib?
@AlexanderRC
Researcher
12 Feb 2014, 07:47
Hi, I have just noticed your message
If you want something small e.g. formula of a single chart I can publish code here. Otherwise please write to email info@algochart.com
@Researcher
Researcher
06 Aug 2013, 01:15
Correct link is here: www.algochart.com
@Researcher