Drawing lines from robots and indicators


Drawing lines from robots and indicators
14 May 2013, 16:04
Three new methods will be introduced in ChartObjects object next release:
1. Generic line:
ChartObjects.DrawLine(objectName, date1, y1, date2, y2, color, [optional] thickness, [optional] style))
ChartObjects.DrawLine(objectName, index1, y1, index2, y2, color, [optional] thickness, [optional] style)
2. Horizontal line:
ChartObjects.DrawHorizontalLine(objectName, y, color, [optional] thickness, [optional] style)
3. Vertical line:
ChartObjects.DrawVerticalLine(objectName, date, color, [optional] thickness, [optional] style)
ChartObjects.DrawVerticalLine(objectName, index, color, [optional] thickness, [optional] style)
The logic of adding, updating and removing chart objects is the same as we already have in DrawText method: objectName identifiers unique created object, if you draw second object with the same name, old one is removed (updated). So if you want to have e.g. several lines at the same time you have to use different object names.
All methods are available in both robots and indicators.
Here we will post several examples of usage.
Replies
cAlgo_Fanatic
14 May 2013, 17:07
Indicator showing Round Numbers based on input step pips calculated between the chart High and Low.

Source Code:
using System;
using cAlgo.API;
namespace cAlgo.Indicators
{
[Indicator(IsOverlay = true)]
public class RoundNumbers : Indicator
{
[Parameter(DefaultValue = 100)]
public int StepPips { get; set; }
protected override void Initialize()
{
double max = MarketSeries.High.Maximum(MarketSeries.High.Count);
double min = MarketSeries.Low.Minimum(MarketSeries.Low.Count);
double step = Symbol.PipSize*StepPips;
double start = Math.Floor(min/step)*step;
for (double level = start; level <= max + step; level += step)
{
ChartObjects.DrawHorizontalLine("line_" + level, level, Colors.Gray);
}
}
public override void Calculate(int index)
{
}
}
}
@cAlgo_Fanatic
cAlgo_Fanatic
14 May 2013, 17:39
Daily High and Low Indicator. Displays horizontal lines that correspond to the daily high and low.

Source Code:
using System;
using cAlgo.API;
namespace cAlgo.Indicators
{
[Indicator(IsOverlay = true)]
public class DailyHighLow : Indicator
{
public override void Calculate(int index)
{
DateTime today = MarketSeries.OpenTime[index].Date;
DateTime tomorrow = today.AddDays(1);
double high = MarketSeries.High.LastValue;
double low = MarketSeries.Low.LastValue;
for (int i = MarketSeries.Close.Count - 1; i > 0; i--)
{
if (MarketSeries.OpenTime[i].Date < today)
break;
high = Math.Max(high, MarketSeries.High[i]);
low = Math.Min(low, MarketSeries.Low[i]);
}
ChartObjects.DrawLine("high " + today, today, high, tomorrow, high, Colors.Pink);
ChartObjects.DrawLine("low " + today, today, low, tomorrow, low, Colors.Pink);
}
}
}
@cAlgo_Fanatic
cAlgo_Fanatic
20 May 2013, 10:00
This is so that the calculation occurs only on loading of the indicator, in the Initialize() method and thereon only when there are new bars, in the Calculate() method.
@cAlgo_Fanatic
Kate
11 Jun 2013, 15:03
Hi, as far as I know, native support for color parameters is not implemented. You can check workaround that I've done here: /algos/indicators/show/289
@Kate
Abhi
28 Sep 2014, 15:38
RE:
cAlgo_Fanatic said:
Daily High and Low Indicator. Displays horizontal lines that correspond to the daily high and low.
Source Code:
using System; using cAlgo.API; namespace cAlgo.Indicators { [Indicator(IsOverlay = true)] public class DailyHighLow : Indicator { public override void Calculate(int index) { DateTime today = MarketSeries.OpenTime[index].Date; DateTime tomorrow = today.AddDays(1); double high = MarketSeries.High.LastValue; double low = MarketSeries.Low.LastValue; for (int i = MarketSeries.Close.Count - 1; i > 0; i--) { if (MarketSeries.OpenTime[i].Date < today) break; high = Math.Max(high, MarketSeries.High[i]); low = Math.Min(low, MarketSeries.Low[i]); } ChartObjects.DrawLine("high " + today, today, high, tomorrow, high, Colors.Pink); ChartObjects.DrawLine("low " + today, today, low, tomorrow, low, Colors.Pink); } } }
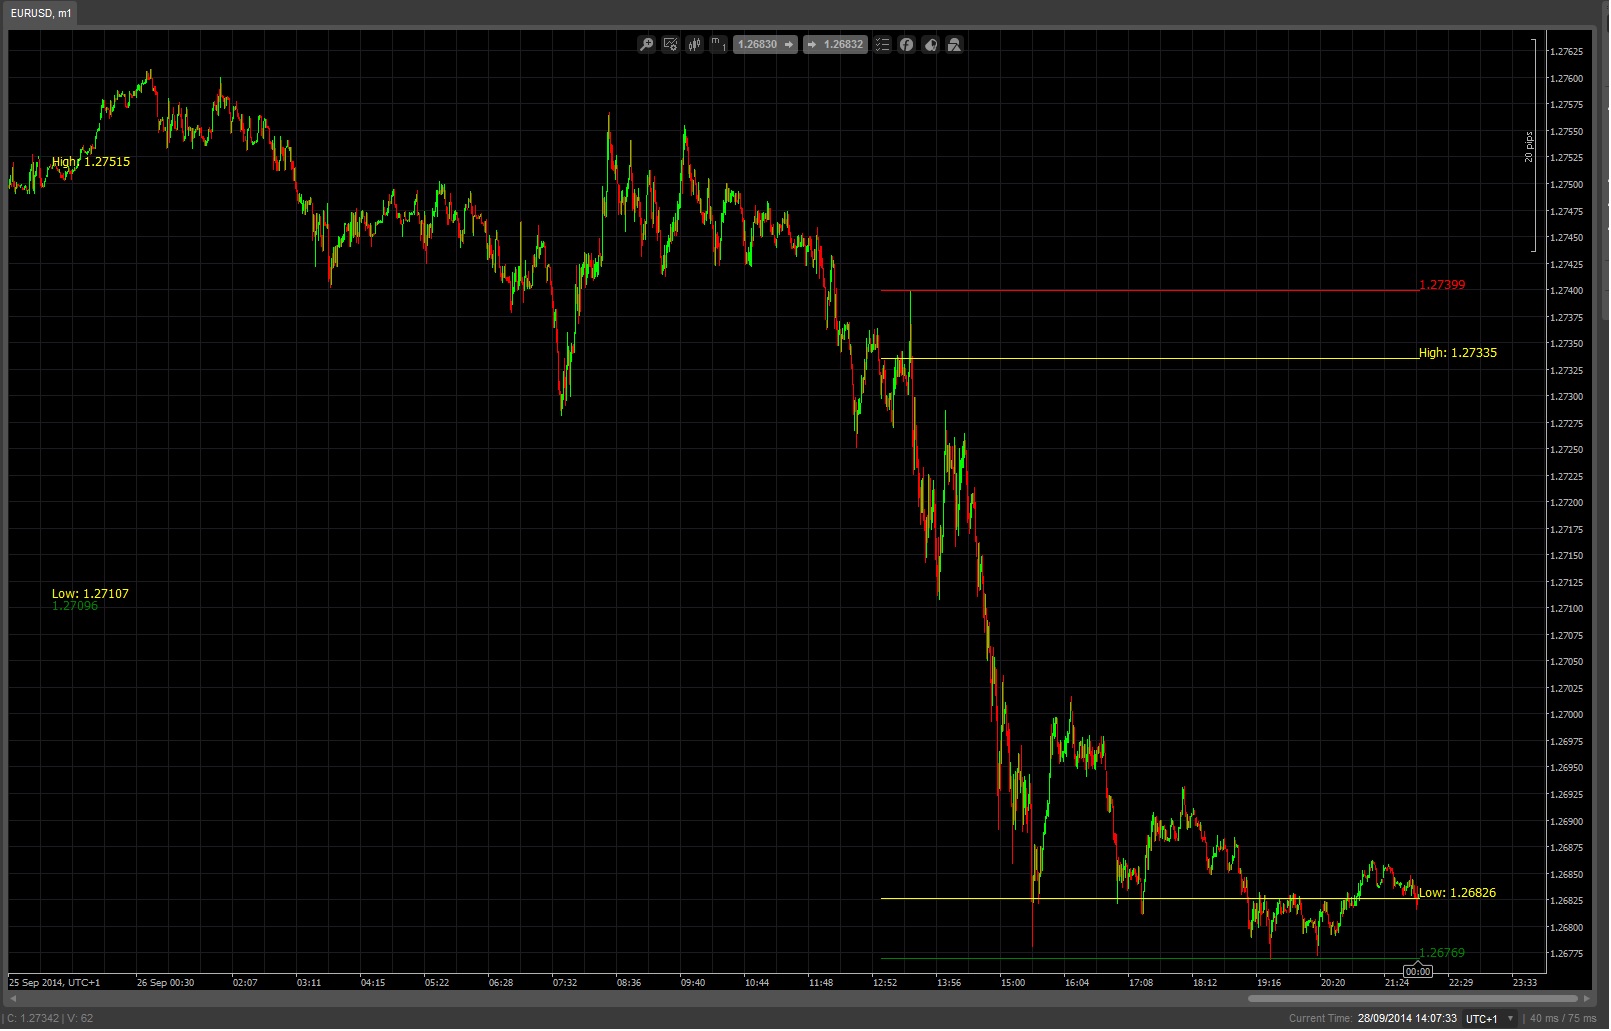
Hi Spotware team, I managed to do some coding but ran into some issues. My chart time settings are UTC+1 (UK time).
I could plot high and low for New York time session between 1 pm and 10 pm but for some reason I cannot plot high and low for the time session between 1 pm and 1:15 pm.
Please can you help.
// Start of the code here
using System;
using cAlgo.API;
using cAlgo.API.Internals;
using cAlgo.API.Indicators;
namespace cAlgo
{
[Indicator(IsOverlay = true, TimeZone = TimeZones.CentralEuropeanStandardTime, AccessRights = AccessRights.None)]
public class AbhiCharts : Indicator
{
protected DateTime today, tomorrow;
protected int ORMinute;
protected TimeSpan NewYorkStartTime, NewYorkEndTime;
protected TimeSpan NewYorkORStartTime, NewYorkOREndTime;
protected double High_NewYorkStartTime, Low_NewYorkEndTime;
protected double High_NewYorkORStartTime, Low_NewYorkOREndTime;
protected DateTime plot_NewYorkStartTime, plot_NewYorkEndTime;
protected int NewYorkStartHour, NewYorkEndHour;
protected int NewYorkORStartHour, NewYorkOREndHour;
protected override void Initialize()
{
ORMinute = 15;
NewYorkStartHour = 14;
NewYorkEndHour = 23;
NewYorkStartTime = new TimeSpan(NewYorkStartHour, 0, 0);
NewYorkEndTime = new TimeSpan(NewYorkEndHour, 0, 0);
NewYorkORStartTime = new TimeSpan(NewYorkStartHour, 0, 0);
NewYorkOREndTime = new TimeSpan(NewYorkStartHour, ORMinute, 0);
}
public override void Calculate(int index)
{
today = MarketSeries.OpenTime[index].Date;
tomorrow = today.AddDays(1);
plot_NewYorkStartTime = today.Date.AddHours(NewYorkStartHour);
plot_NewYorkEndTime = today.Date.AddHours(NewYorkEndHour);
High_NewYorkStartTime = MarketSeries.High.LastValue;
Low_NewYorkEndTime = MarketSeries.Low.LastValue;
High_NewYorkORStartTime = MarketSeries.High.LastValue;
Low_NewYorkOREndTime = MarketSeries.Low.LastValue;
for (int i = MarketSeries.Close.Count - 1; i > 0; i--)
{
if (MarketSeries.OpenTime[i].Date < today)
break;
if ((MarketSeries.OpenTime[i].TimeOfDay >= NewYorkStartTime) && (MarketSeries.OpenTime[i].TimeOfDay <= NewYorkEndTime))
{
High_NewYorkStartTime = Math.Max(High_NewYorkStartTime, MarketSeries.High[i]);
Low_NewYorkEndTime = Math.Min(Low_NewYorkEndTime, MarketSeries.Low[i]);
}
if ((MarketSeries.OpenTime[i].TimeOfDay >= NewYorkORStartTime) && (MarketSeries.OpenTime[i].TimeOfDay <= NewYorkOREndTime))
{
High_NewYorkORStartTime = Math.Max(High_NewYorkORStartTime, MarketSeries.High[i]);
Low_NewYorkOREndTime = Math.Min(Low_NewYorkOREndTime, MarketSeries.Low[i]);
}
}
ChartObjects.DrawLine("High " + today, plot_NewYorkStartTime, High_NewYorkStartTime, plot_NewYorkEndTime, High_NewYorkStartTime, Colors.Red);
ChartObjects.DrawLine("Low " + today, plot_NewYorkStartTime, Low_NewYorkEndTime, plot_NewYorkEndTime, Low_NewYorkEndTime, Colors.Green);
ChartObjects.DrawText("TextHigh " + today, string.Format("{0}", High_NewYorkStartTime), index, High_NewYorkStartTime, VerticalAlignment.Top, HorizontalAlignment.Right, Colors.Red);
ChartObjects.DrawText("TextLow " + today, string.Format("{0}", Low_NewYorkEndTime), index, Low_NewYorkEndTime, VerticalAlignment.Top, HorizontalAlignment.Right, Colors.Green);
ChartObjects.DrawLine("HighOR " + today, plot_NewYorkStartTime, High_NewYorkORStartTime, plot_NewYorkEndTime, High_NewYorkORStartTime, Colors.Yellow);
ChartObjects.DrawLine("LowOR " + today, plot_NewYorkStartTime, Low_NewYorkOREndTime, plot_NewYorkEndTime, Low_NewYorkOREndTime, Colors.Yellow);
ChartObjects.DrawText("TextHighOR " + today, string.Format("High: {0}", High_NewYorkORStartTime), index, High_NewYorkORStartTime, VerticalAlignment.Top, HorizontalAlignment.Right, Colors.Yellow);
ChartObjects.DrawText("TextLowOR " + today, string.Format("Low: {0}", Low_NewYorkOREndTime), index, Low_NewYorkOREndTime, VerticalAlignment.Top, HorizontalAlignment.Right, Colors.Yellow);
//string text = string.Format("MarketSeries.OpenTime[i].TimeOfDay : {0}", MarketSeries.OpenTime[i].TimeOfDay);
//ChartObjects.DrawText("Diff", text, StaticPosition.TopLeft, Colors.Lime);
}
}
}
@Abhi
Spotware
29 Sep 2014, 12:24
We recommend you to post a job in Jobs section or contact one of cAlgo consultants.
@Spotware
Abhi
01 Oct 2014, 12:13
RE:
Spotware said:
We recommend you to post a job in Jobs section or contact one of cAlgo consultants.
no worries, I guess that was a very polite hint. :-)
never mind, I sorted it out.
@Abhi
bachapk
25 Dec 2014, 03:17
RE:
Hi
Can we get index-10th bar value of Upper line in this example? If yes then how? As I didn't see any example of how to retrieve value from a line specially trend line.
Looking forward
Regards
Bacha
cAlgo_Development said:
Indicator drawing trend-lines automatically using specified period (minimum distance between high and low extremums):
Source code:
using System; using cAlgo.API; using cAlgo.API.Indicators; namespace cAlgo.Indicators { [Indicator(IsOverlay = true)] public class TrendLines : Indicator { [Parameter(DefaultValue = 30, MinValue = 1)] public int Period { get; set; } protected override void Initialize() { RedrawLines(); } public override void Calculate(int index) { if (IsRealTime) RedrawLines(); } private void RedrawLines() { int count = MarketSeries.Close.Count; int maxIndex1 = FindNextLocalExtremum(MarketSeries.High, count - 1, true); int maxIndex2 = FindNextLocalExtremum(MarketSeries.High, maxIndex1 - Period, true); int minIndex1 = FindNextLocalExtremum(MarketSeries.Low, count - 1, false); int minIndex2 = FindNextLocalExtremum(MarketSeries.Low, minIndex1 - Period, false); int startIndex = Math.Min(maxIndex2, minIndex2) - 100; int endIndex = count + 100; DrawTrendLine("high", startIndex, endIndex, maxIndex1, MarketSeries.High[maxIndex1], maxIndex2, MarketSeries.High[maxIndex2]); DrawTrendLine("low", startIndex, endIndex, minIndex1, MarketSeries.Low[minIndex1], minIndex2, MarketSeries.Low[minIndex2]); } private void DrawTrendLine(string lineName, int startIndex, int endIndex, int index1, double value1, int index2, double value2) { double gradient = (value2 - value1) / (index2 - index1); double startValue = value1 + (startIndex - index1) * gradient; double endValue = value1 + (endIndex - index1) * gradient; ChartObjects.DrawLine(lineName, startIndex, startValue, endIndex, endValue, Colors.Gray); ChartObjects.DrawLine(lineName+"_red", index1, value1, index2, value2, Colors.Red); } private int FindNextLocalExtremum(DataSeries series, int maxIndex, bool findMax) { for (int index = maxIndex; index >= 0; index --) { if (IsLocalExtremum(series, index, findMax)) { return index; } } return 0; } private bool IsLocalExtremum(DataSeries series, int index, bool findMax) { int end = Math.Min(index + Period, series.Count - 1); int start = Math.Max(index - Period, 0); double value = series[index]; for (int i = start; i < end; i++) { if (findMax && value < series[i]) return false; if (!findMax && value > series[i]) return false; } return true; } } }

@bachapk
Anka Software
28 Dec 2014, 16:28
RE: RE:
Can you provide examples / links of Robots using DrawLine?
Regards
Vivek
@Anka Software
crank
04 Jan 2015, 15:38
RE:
How would I display just the numerical value of the linear regression slope of these two trendlines on the chart? I don't need to graph anything, just the numerical values of the two slopes in the top left corner of the existing price chart.
cAlgo_Development said:
Indicator drawing trend-lines automatically using specified period (minimum distance between high and low extremums):
Source code:
using System; using cAlgo.API; using cAlgo.API.Indicators; namespace cAlgo.Indicators { [Indicator(IsOverlay = true)] public class TrendLines : Indicator { [Parameter(DefaultValue = 30, MinValue = 1)] public int Period { get; set; } protected override void Initialize() { RedrawLines(); } public override void Calculate(int index) { if (IsRealTime) RedrawLines(); } private void RedrawLines() { int count = MarketSeries.Close.Count; int maxIndex1 = FindNextLocalExtremum(MarketSeries.High, count - 1, true); int maxIndex2 = FindNextLocalExtremum(MarketSeries.High, maxIndex1 - Period, true); int minIndex1 = FindNextLocalExtremum(MarketSeries.Low, count - 1, false); int minIndex2 = FindNextLocalExtremum(MarketSeries.Low, minIndex1 - Period, false); int startIndex = Math.Min(maxIndex2, minIndex2) - 100; int endIndex = count + 100; DrawTrendLine("high", startIndex, endIndex, maxIndex1, MarketSeries.High[maxIndex1], maxIndex2, MarketSeries.High[maxIndex2]); DrawTrendLine("low", startIndex, endIndex, minIndex1, MarketSeries.Low[minIndex1], minIndex2, MarketSeries.Low[minIndex2]); } private void DrawTrendLine(string lineName, int startIndex, int endIndex, int index1, double value1, int index2, double value2) { double gradient = (value2 - value1) / (index2 - index1); double startValue = value1 + (startIndex - index1) * gradient; double endValue = value1 + (endIndex - index1) * gradient; ChartObjects.DrawLine(lineName, startIndex, startValue, endIndex, endValue, Colors.Gray); ChartObjects.DrawLine(lineName+"_red", index1, value1, index2, value2, Colors.Red); } private int FindNextLocalExtremum(DataSeries series, int maxIndex, bool findMax) { for (int index = maxIndex; index >= 0; index --) { if (IsLocalExtremum(series, index, findMax)) { return index; } } return 0; } private bool IsLocalExtremum(DataSeries series, int index, bool findMax) { int end = Math.Min(index + Period, series.Count - 1); int start = Math.Max(index - Period, 0); double value = series[index]; for (int i = start; i < end; i++) { if (findMax && value < series[i]) return false; if (!findMax && value > series[i]) return false; } return true; } } }
@crank
hiba7rain
08 Feb 2015, 08:14
RE:
Thanks for any new updates but i just have a question, is the chart objects on both indicators and robots will have a readable value?
for example as trader if i draw a line that i see as a resistance or support line or a trend line it would be help full for me if i am able to use it to send me email notifications or even to trade the line (object) once the price hit the line, currently yes it is possible for placing the orders on same horizontal lines that we may draw but it is not possible for trend lines that we draw on charts hope you consider such function and make it available even without the need for us to create indicators or robots to use the new functions
thanks
cAlgo_Development said:
Three new methods will be introduced in ChartObjects object next release:
1. Generic line:
ChartObjects.DrawLine(objectName, date1, y1, date2, y2, color, [optional] thickness, [optional] style)) ChartObjects.DrawLine(objectName, index1, y1, index2, y2, color, [optional] thickness, [optional] style)
2. Horizontal line:
ChartObjects.DrawHorizontalLine(objectName, y, color, [optional] thickness, [optional] style)
3. Vertical line:
ChartObjects.DrawVerticalLine(objectName, date, color, [optional] thickness, [optional] style) ChartObjects.DrawVerticalLine(objectName, index, color, [optional] thickness, [optional] style)
The logic of adding, updating and removing chart objects is the same as we already have in DrawText method: objectName identifiers unique created object, if you draw second object with the same name, old one is removed (updated). So if you want to have e.g. several lines at the same time you have to use different object names.
All methods are available in both robots and indicators.
Here we will post several examples of usage.
@hiba7rain
Rod_Sands
08 Feb 2015, 08:51
Is there (planned) a method DrawRectangle, DrawTriangle etc?
@Rod_Sands
Rod_Sands
08 Feb 2015, 09:16
RE: RE:
Seems that Objects are still not accessible
"....Currently it is not possible to access trend lines or other chart objects from cAlgo API. We plan to include such functionality in the future"
cAlgo is a lame duck without this functionality
hiba7rain said:
Thanks for any new updates but i just have a question, is the chart objects on both indicators and robots will have a readable value?
for example as trader if i draw a line that i see as a resistance or support line or a trend line it would be help full for me if i am able to use it to send me email notifications or even to trade the line (object) once the price hit the line, currently yes it is possible for placing the orders on same horizontal lines that we may draw but it is not possible for trend lines that we draw on charts hope you consider such function and make it available even without the need for us to create indicators or robots to use the new functions
thanks
cAlgo_Development said:
Three new methods will be introduced in ChartObjects object next release:
1. Generic line:
ChartObjects.DrawLine(objectName, date1, y1, date2, y2, color, [optional] thickness, [optional] style)) ChartObjects.DrawLine(objectName, index1, y1, index2, y2, color, [optional] thickness, [optional] style)
2. Horizontal line:
ChartObjects.DrawHorizontalLine(objectName, y, color, [optional] thickness, [optional] style)
3. Vertical line:
ChartObjects.DrawVerticalLine(objectName, date, color, [optional] thickness, [optional] style) ChartObjects.DrawVerticalLine(objectName, index, color, [optional] thickness, [optional] style)
The logic of adding, updating and removing chart objects is the same as we already have in DrawText method: objectName identifiers unique created object, if you draw second object with the same name, old one is removed (updated). So if you want to have e.g. several lines at the same time you have to use different object names.
All methods are available in both robots and indicators.
Here we will post several examples of usage.
@Rod_Sands
magforex
30 Oct 2015, 15:54
RE:
cAlgo_Fanatic said:
Daily High and Low Indicator. Displays horizontal lines that correspond to the daily high and low.
Source Code:
using System; using cAlgo.API; namespace cAlgo.Indicators { [Indicator(IsOverlay = true)] public class DailyHighLow : Indicator { public override void Calculate(int index) { DateTime today = MarketSeries.OpenTime[index].Date; DateTime tomorrow = today.AddDays(1); double high = MarketSeries.High.LastValue; double low = MarketSeries.Low.LastValue; for (int i = MarketSeries.Close.Count - 1; i > 0; i--) { if (MarketSeries.OpenTime[i].Date < today) break; high = Math.Max(high, MarketSeries.High[i]); low = Math.Min(low, MarketSeries.Low[i]); } ChartObjects.DrawLine("high " + today, today, high, tomorrow, high, Colors.Pink); ChartObjects.DrawLine("low " + today, today, low, tomorrow, low, Colors.Pink); } } }
Hi Spotware, how do I control if I only want the current day or maybe only 2 days high and low only? Can you give me a hint? thanks!
@magforex
Chistabo
13 Dec 2015, 20:28
RE: RE:
magforex said:
cAlgo_Fanatic said:
Daily High and Low Indicator. Displays horizontal lines that correspond to the daily high and low.
Source Code:
using System; using cAlgo.API; namespace cAlgo.Indicators { [Indicator(IsOverlay = true)] public class DailyHighLow : Indicator { public override void Calculate(int index) { DateTime today = MarketSeries.OpenTime[index].Date; DateTime tomorrow = today.AddDays(1); double high = MarketSeries.High.LastValue; double low = MarketSeries.Low.LastValue; for (int i = MarketSeries.Close.Count - 1; i > 0; i--) { if (MarketSeries.OpenTime[i].Date < today) break; high = Math.Max(high, MarketSeries.High[i]); low = Math.Min(low, MarketSeries.Low[i]); } ChartObjects.DrawLine("high " + today, today, high, tomorrow, high, Colors.Pink); ChartObjects.DrawLine("low " + today, today, low, tomorrow, low, Colors.Pink); } } }
Hi Spotware, how do I control if I only want the current day or maybe only 2 days high and low only? Can you give me a hint? thanks!
for (int i = MarketSeries.Close.Count - 1; i > 0; i--)
{
if (MarketSeries.OpenTime[i].Date < today)
break;
high = Math.Max(high, MarketSeries.High[i]);
low = Math.Min(low, MarketSeries.Low[i]);
}
In this case 'int i = MarketSeries.Close.Count - 1' defines a number of iritations that equals all 'close' values found on chart = back to the beginning of available chart data. So, setting this to i.e. 2 would do.
I guess. Have not tried.
Simon
@Chistabo
huupie_heijntje
11 Jul 2016, 23:24
Why is it that if I draw objects from a custom indicator they do show up on the chart, but when drawing them from a robot they don't? I tied to run the robot in a backtest as well as on a live chart.
@huupie_heijntje
Vitali Gajdabrus
16 Jan 2017, 22:06
RE:
2. Horizontal line:ChartObjects.DrawHorizontalLine(objectName, y, color, [optional] thickness, [optional] style)
How to set the color:
Color FromArgb( int alpha, int red, int green, int blue) ?
First of all I am interested in transparency - int alpha.
I can draw a band msdn "StripLine Class"?
I want to develop an indicator for cTrader:

This can be done on cAlgo?
Sorry for my English is not Oxford.
Извините за мой слегка шершавый английский. Поэтому если что - то можно по русски.
@Vitali Gajdabrus
Vitali Gajdabrus
18 Jan 2017, 15:00
RE: RE:
Vitali Gajdabrus said:
How to set the color:Color FromArgb( int alpha, int red, int green, int blue) ?First of all I am interested in transparency - int alpha.
I can draw a band msdn "StripLine Class"?
I want to develop an indicator for cTrader:
This can be done on cAlgo?
Can I get the coordinates of the cursor in the processing of events MouseClick, MouseDoubleClick, MouseDown, MoseLeave, MuseTove, the MouseUp, and the like to the program trading robots draw on the chart.
@Vitali Gajdabrus
Vitali Gajdabrus
20 Jan 2017, 21:43
RE: RE: RE:
Can I get the coordinates of the cursor in the processing of events MouseClick, MouseDoubleClick, MouseDown, MoseLeave, MuseTove, the MouseUp, and the like to the program trading robots draw on the chart.
On the issue of transparency, color and found the answer. Please excuse me for my carelessness.
Interested in response to the second question.
@Vitali Gajdabrus
Vitali Gajdabrus
23 Jan 2017, 09:03
RE: RE: RE: RE:
Vitali Gajdabrus said:
Can I get the coordinates of the cursor in the processing of events MouseClick, MouseDoubleClick, MouseDown, MoseLeave, MuseTove, the MouseUp, and the like to the program trading robots draw on the chart.
Regrettable very poor support cAlgo... :(
@Vitali Gajdabrus
... Deleted by UFO ...
... Deleted by UFO ...
meow/meow?
20 Feb 2017, 14:42
RE: RE: RE: test
akhizhniy said:
Vitali Gajdabrus said:
test
test
@meow/meow?
johnreygalax8
23 Jul 2018, 18:30
( Updated at: 21 Dec 2023, 09:20 )
RE:
hi is there a way to highlight the corresponding whole number???
so it will look like this  cAlgo_Fanatic said:
Indicator showing Round Numbers based on input step pips calculated between the chart High and Low.
Source Code:
using System; using cAlgo.API; namespace cAlgo.Indicators { [Indicator(IsOverlay = true)] public class RoundNumbers : Indicator { [Parameter(DefaultValue = 100)] public int StepPips { get; set; } protected override void Initialize() { double max = MarketSeries.High.Maximum(MarketSeries.High.Count); double min = MarketSeries.Low.Minimum(MarketSeries.Low.Count); double step = Symbol.PipSize*StepPips; double start = Math.Floor(min/step)*step; for (double level = start; level <= max + step; level += step) { ChartObjects.DrawHorizontalLine("line_" + level, level, Colors.Gray); } } public override void Calculate(int index) { } } }
@johnreygalax8
einrel.lernie
29 Apr 2020, 19:41
( Updated at: 21 Dec 2023, 09:22 )
RE: RE:
I'm looking for this highlight as well. Is there any property for this? Even if its not related to the lines will do.
Or maybe some tooltips?
Thanks.
johnreygalax8 said:
hi is there a way to highlight the corresponding whole number???
so it will look like this
Indicator showing Round Numbers based on input step pips calculated between the chart High and Low.
Source Code:
using System; using cAlgo.API; namespace cAlgo.Indicators { [Indicator(IsOverlay = true)] public class RoundNumbers : Indicator { [Parameter(DefaultValue = 100)] public int StepPips { get; set; } protected override void Initialize() { double max = MarketSeries.High.Maximum(MarketSeries.High.Count); double min = MarketSeries.Low.Minimum(MarketSeries.Low.Count); double step = Symbol.PipSize*StepPips; double start = Math.Floor(min/step)*step; for (double level = start; level <= max + step; level += step) { ChartObjects.DrawHorizontalLine("line_" + level, level, Colors.Gray); } } public override void Calculate(int index) { } } }
@einrel.lernie
PanagiotisCharalampous
30 Apr 2020, 08:25
Hi einrel.lernie,
If you want to have labels for the horizontal lines on the Y axis, you need to make them interactive.
Best Regards,
Panagiotis
@PanagiotisCharalampous
... Deleted by UFO ...
... Deleted by UFO ...
... Deleted by UFO ...
... Deleted by UFO ...
... Deleted by UFO ...
... Deleted by UFO ...
... Deleted by UFO ...
... Deleted by UFO ...
... Deleted by UFO ...
cAlgo_Development
14 May 2013, 16:11
Indicator drawing trend-lines automatically using specified period (minimum distance between high and low extremums):
Source code:
using System;
using cAlgo.API;
using cAlgo.API.Indicators;

namespace cAlgo.Indicators
{
    [Indicator(IsOverlay = true)]
    public class TrendLines : Indicator
    {
    	[Parameter(DefaultValue = 30, MinValue = 1)]
        public int Period { get; set; }

        protected override void Initialize()
        {
            RedrawLines();
        }

        public override void Calculate(int index)
        {
            if (IsRealTime)
                RedrawLines();
        }

        private void RedrawLines()
        {
            int count = MarketSeries.Close.Count;

            int maxIndex1 = FindNextLocalExtremum(MarketSeries.High, count - 1, true);
            int maxIndex2 = FindNextLocalExtremum(MarketSeries.High, maxIndex1 - Period, true);

            int minIndex1 = FindNextLocalExtremum(MarketSeries.Low, count - 1, false);
            int minIndex2 = FindNextLocalExtremum(MarketSeries.Low, minIndex1 - Period, false);

            int startIndex = Math.Min(maxIndex2, minIndex2) - 100;
            int endIndex = count + 100;

            DrawTrendLine("high", startIndex, endIndex, maxIndex1, MarketSeries.High[maxIndex1],
                maxIndex2, MarketSeries.High[maxIndex2]);

            DrawTrendLine("low", startIndex, endIndex, minIndex1, MarketSeries.Low[minIndex1],
                minIndex2, MarketSeries.Low[minIndex2]);
        }

        private void DrawTrendLine(string lineName, int startIndex,
            int endIndex, int index1, double value1, int index2, double value2)
        {
            double gradient = (value2 - value1) / (index2 - index1);

            double startValue = value1 + (startIndex - index1) * gradient;
            double endValue = value1 + (endIndex - index1) * gradient;

            ChartObjects.DrawLine(lineName, startIndex, startValue, endIndex, endValue, Colors.Gray);
            ChartObjects.DrawLine(lineName+"_red", index1, value1, index2, value2, Colors.Red);
        }

        private int FindNextLocalExtremum(DataSeries series, int maxIndex, bool findMax)
        {
            for (int index = maxIndex; index >= 0; index --)
            {
                if (IsLocalExtremum(series, index, findMax))
                {
                    return index;
                }
            }
            return 0;
        }

        private bool IsLocalExtremum(DataSeries series, int index, bool findMax)
        {
        	int end = Math.Min(index + Period, series.Count - 1);
        	int start = Math.Max(index - Period, 0);

        	double value = series[index];

        	for (int i = start; i  series[i])
        			return false;
        	}
        	return true;
        }
    }
}
@cAlgo_Development