Description
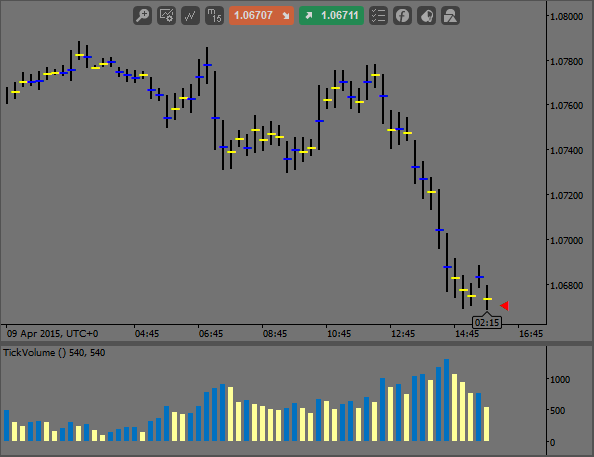
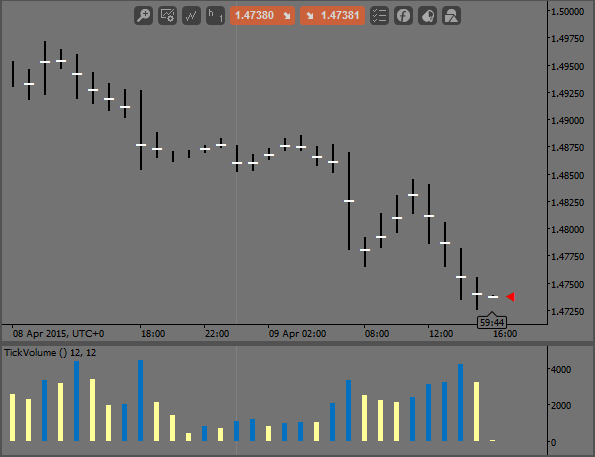
This is the VWAP (version 1.1), or volume weighted average price for every individual bar. For timeframes shorter than daily it uses minute data up to the current second and then continues the calculation seamlessly with realtime tick volume for an accurate realtime VWAP display. For longer timeframes it uses 10 minute data, with only slight inaccuracies.
DO NOT copy & paste and then try to compile the code yourself!
The forum software introduces garbage symbols that I have no control over. I don't post the source code myself. The forum software extracts the source code from the uploaded file and what you see is the actual code that was included and compiled. So you can safely download.
Sometimes there are periods in the chart that can't be properly displayed and are subsequently filtered. These periods appear as blank periods. On my charts for example this happens every day between 21:45 - 22:15 UTC. This only affects the historical VWAP. The realtime calculation usually works out fine because the indicator counts its own volume.
Note that if the indicator's values are off, all you have to do is right-click on the chart and select refresh. This should work out any problem during the first start up of the indicator. If that doesn't work, you may switch to another timeframe and then back to your original timeframe.
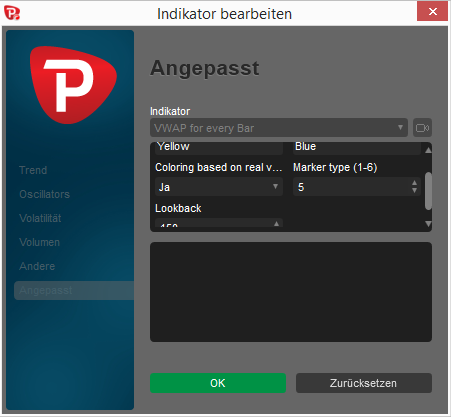
Indicator Options
Volume down & up color: This controls the coloring of the VWAP depending on the relation of the current volume to the previous volume. If the volume is up compared to the previous period's volume then the VWAP is colored the up color. If the volume is down it gets the down volume color. Here is a list of valid color names: http://ctdn.com/api/reference/colors
You have to write their full name out.
Coloring based on real volume: As mentioned the indicator counts its own volume. All it does is it increments a counter with every incoming tick. This results in a significant overhead of 20%-70% compared to the platforms reported tick volume for that period because the platform does not use true tick volume in its data collection. Rather it counts ticks that have a price difference to the previous tick and discards prices that have the same value. Therefore the platforms volume is really just price change event volume, or up and down tick volume. However, in my experience most of the time the relative volume differences are the same. On some occasions however this might still effect the coloring of the VWAPs. Turn this option off to use the platforms reported volume and to prevent any disruption due to the higher volume levels after indicator startup. Or turn it on to discover hidden high volume turns more effectively.
Marker type: The VWAPs are displayed as ASCII or unicode symbols (dashes) that I copied from various sites. You can change their appearance by selecting marker 1 through 6. Let me know if you have problems with the symbols.
Lookback: Included for performance reasons you can control how far back you want to display the VWAPs. On my platform it goes back only 7 days due to the lack of minute data. Therefore it won't display anything before that. You can safely choose a high value without harm though. There seems to be no performance hit, neither on historical download nor realtime calculation and display.
This is version 1.1
V1.01: Re-enabled the 1 Minute timeframe. This seems to work for scalpers.
V1.02: New menu point. Changed the underlying coloring method. Various text edits on this page.
V1.1: For longer timeframes than intraday 10 minute data is now used for a longer data plot into the past. This is automatic once the user selects a timeframe equal to or higher than daily.
Examples:
// This is the VWAP Version 1.1
// Come back to
// http://ctdn.com/algos/indicators/show/792
// to get the latest version
using System;
using cAlgo.API;
using cAlgo.API.Internals;
using cAlgo.API.Indicators;
namespace cAlgo
{
[Indicator(IsOverlay = true, AccessRights = AccessRights.None)]
public class VWAPforeveryBar : Indicator
{
[Parameter("Volume Down Color", DefaultValue = "Yellow")]
public string VolumeDownColor { get; set; }
[Parameter("Volume Up Color", DefaultValue = "Blue")]
public string VolumeUpColor { get; set; }
[Parameter("Coloring based on real volume?", DefaultValue = "false")]
public bool UseRealVolume { get; set; }
[Parameter("Marker type (1-6)", DefaultValue = 5, MinValue = 1, MaxValue = 6)]
public int MarkerType { get; set; }
[Parameter("Lookback", DefaultValue = 150)]
public int Lookback { get; set; }
private string[] Markers = new string[7]
{
"",
"â¬",
"â",
"ââ",
"ââââ",
"â",
"â"
};
public double[,] RealtimeVwap = new double[700, 2];
public MarketSeries M1;
public int BarCount;
protected override void Initialize()
{
// Calculate all VWAPS once
if (MarketSeries.TimeFrame < TimeFrame.Daily)
M1 = MarketData.GetSeries(TimeFrame.Minute);
else
M1 = MarketData.GetSeries(TimeFrame.Minute10);
for (int idx = (MarketSeries.Close.Count - 2) - Lookback; idx <= MarketSeries.Close.Count - 2; idx++)
{
double M1Vwap = 0;
int M1FirstIndex = M1.OpenTime.GetIndexByTime(MarketSeries.OpenTime[idx]);
if (M1FirstIndex != -1)
{
for (int i = M1FirstIndex; i < M1.OpenTime.GetIndexByTime(MarketSeries.OpenTime[idx + 1]); i++)
{
M1Vwap += M1.Median[i] * M1.TickVolume[i];
}
}
else
continue;
M1Vwap = M1Vwap / MarketSeries.TickVolume[idx];
if (M1Vwap <= MarketSeries.High[idx] && M1Vwap >= MarketSeries.Low[idx])
ChartObjects.DrawText("vwap" + idx, Markers[MarkerType], idx, M1Vwap, VerticalAlignment.Center, HorizontalAlignment.Center, MarketSeries.TickVolume[idx] >= MarketSeries.TickVolume[idx - 1] ? (Colors)Enum.Parse(typeof(Colors), VolumeUpColor, true) : (Colors)Enum.Parse(typeof(Colors), VolumeDownColor, true));
}
// Prepare vwap of the current bar with minute data for incoming realtime tick data
for (int i = M1.OpenTime.GetIndexByTime(MarketSeries.OpenTime.LastValue); i <= M1.Close.Count - 1; i++)
{
RealtimeVwap[0, 0] += M1.Median[i] * M1.TickVolume[i];
}
RealtimeVwap[0, 1] = MarketSeries.TickVolume.LastValue;
BarCount = MarketSeries.Close.Count - 1;
}
public override void Calculate(int index)
{
// Realtime data collection, calculation and display of current VWAP
if (IsLastBar)
{
int RealtimeIndex = index - BarCount;
RealtimeVwap[RealtimeIndex, 1]++;
RealtimeVwap[RealtimeIndex, 0] += MarketSeries.Close[index];
bool TickVolumeHigher;
if (UseRealVolume == true)
{
if (RealtimeIndex > 0)
if (RealtimeVwap[RealtimeIndex, 1] > RealtimeVwap[RealtimeIndex - 1, 1])
TickVolumeHigher = true;
else
TickVolumeHigher = false;
else if (RealtimeVwap[RealtimeIndex, 1] > MarketSeries.TickVolume[index - 1])
TickVolumeHigher = true;
else
TickVolumeHigher = false;
}
else if (MarketSeries.TickVolume[index] > MarketSeries.TickVolume[index - 1])
TickVolumeHigher = true;
else
TickVolumeHigher = false;
ChartObjects.DrawText("vwap" + index, Markers[MarkerType], index, RealtimeVwap[RealtimeIndex, 0] / RealtimeVwap[RealtimeIndex, 1], VerticalAlignment.Center, HorizontalAlignment.Center, TickVolumeHigher == true ? (Colors)Enum.Parse(typeof(Colors), VolumeUpColor, true) : (Colors)Enum.Parse(typeof(Colors), VolumeDownColor, true));
}
}
}
}
9600302
Joined on 19.03.2015
- Distribution: Free
- Language: C#
- Trading platform: cTrader Automate
- File name: VWAP for every Bar V1.1.algo
- Rating: 5
- Installs: 5053
- Modified: 13/10/2021 09:54

Comments

Hi Alexander,
Good job thanks for sharing.
I really can not see any difference between the real mode and the mode platform. Could you paste an image showing the difference?
Thanks and regards
Hola Alexander, gracias por el indicador.
Es posible modificar el marker type por puntos ?