Description
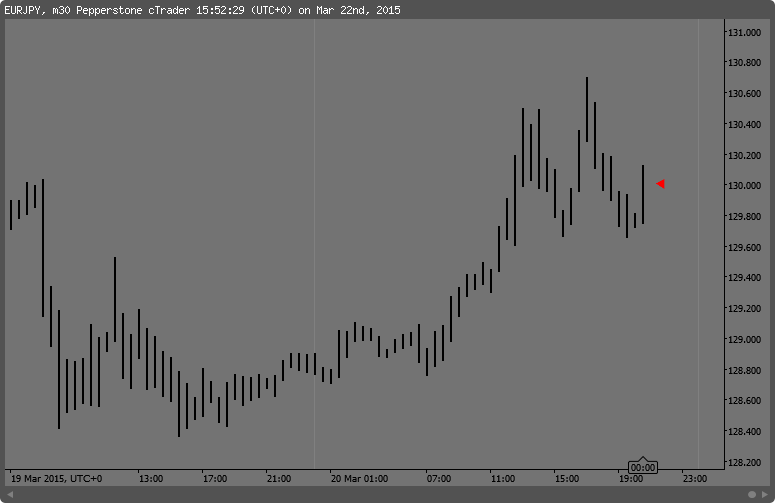
Here you have the HL barchart, without the open and close dashes of the standard OHLC appearance, that are in my opinion arbitrary and therefore useless.
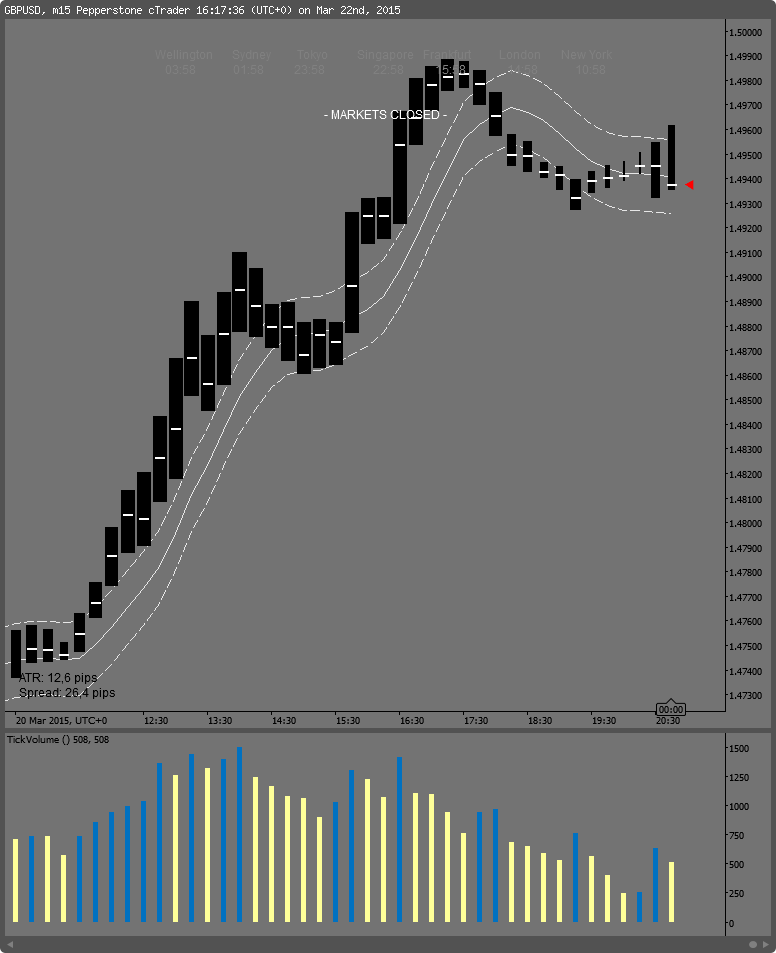
You have to switch to line chart and change the "Bear Outline" color to the same as your background color of the underlying chart to make the price series disappear. Currently there is no other way to hide the price series.
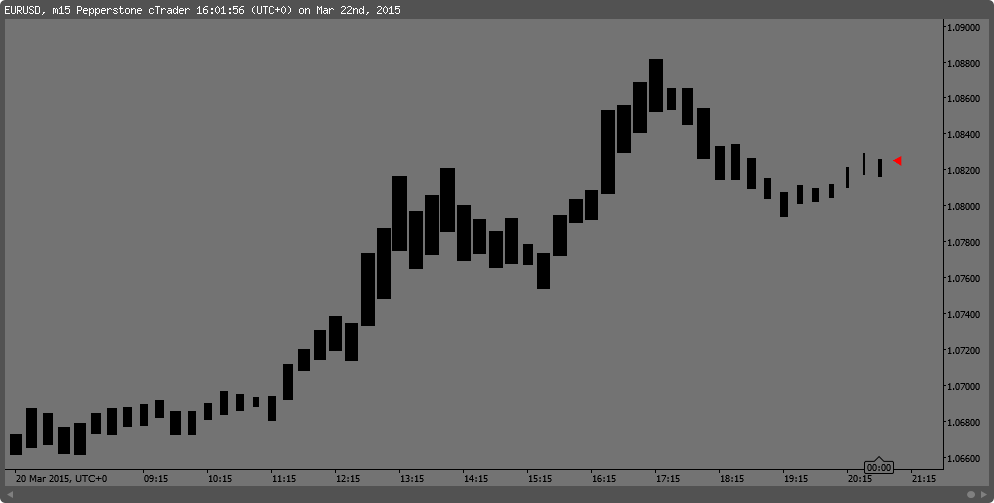
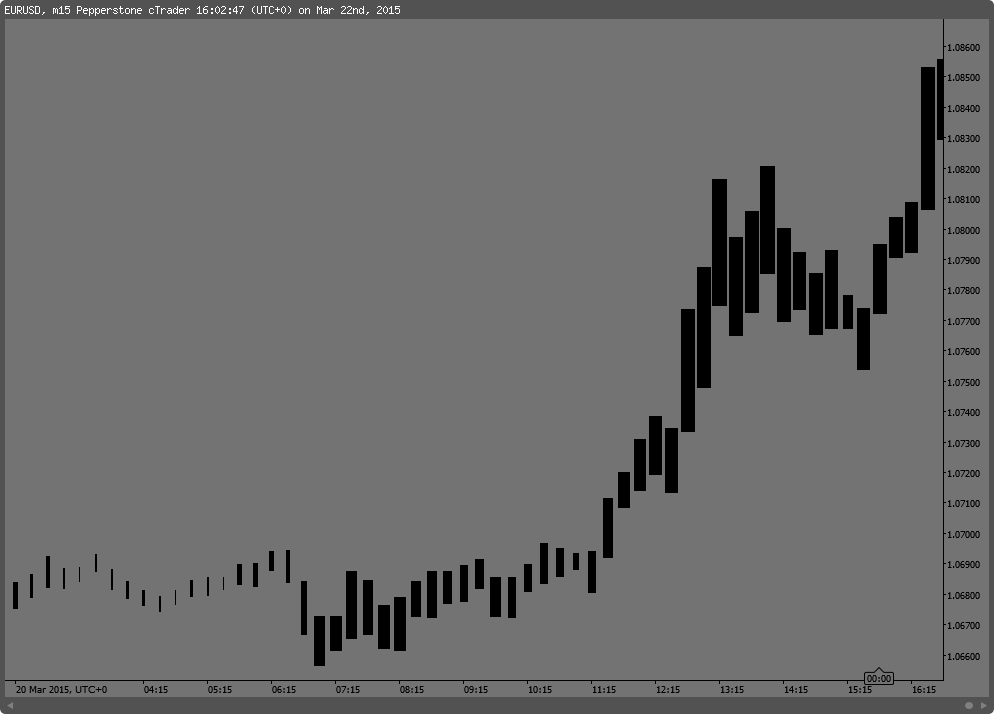
With the "Volume Bars?" parameter switched to "yes" it turns into the SierraChart style high-low volume barchart, where the width of the bars is determined by the underlying volume. This can be controlled with the "Minimum Bar Thickness" and the "Max. Bar Thickness (Volume Bars)" parameter. Note that these are NOT tick or volume charts where the volume would be the same for every bar. I wanted to create something that resembles what is sometimes called "equivolume charts" as close as possible.
It is self adjusting to current volume levels. This can be controlled with the "Lookback" parameter that controls the window width of the volume analysis.
It also features a current price marker (see red triangle at the end of the priceseries), for those who don't like the distractiveness and the cluttering of the platforms own bid-ask lines.
Right now all the colors can only be chosen by typing in the name of the color.
Changes:
V1.01: Corrected a minor flaw in the algorithm
V1.02: Removed unnessessary lines of code and further optimized logic. Removed redundant variable declarations.
V1.03: Speed increase up to 25% by removing redundant operations. Changed the categorization process to exclude current forming bar.
V1.04 Corrected a problem were some bars would be wrongly categorized and appear too thin in the Volume Barchart.


//This is Version 1.04
// Go to
// http://ctdn.com/algos/indicators/show/735
// to grab the newest
using System;
using cAlgo.API;
using cAlgo.API.Internals;
using cAlgo.API.Indicators;
namespace cAlgo
{
[Indicator(IsOverlay = true, AccessRights = AccessRights.None)]
public class HLVolumeBars : Indicator
{
[Parameter("Minimum Bar Thickness", DefaultValue = 2, MinValue = 1, MaxValue = 5)]
public int MinBarThickness { get; set; }
[Parameter("Volume Bars?", DefaultValue = false)]
public bool VolumeBars { get; set; }
[Parameter("Max. Bar Thickness (Volume Bars)", DefaultValue = 10, MinValue = 6, MaxValue = 15)]
public int MaxBarThickness { get; set; }
[Parameter("Lookback for Volume Bars", DefaultValue = 500, MinValue = 100, MaxValue = 1000)]
public int Lookback { get; set; }
[Parameter("Bar Color", DefaultValue = "Black")]
public string BarColor { get; set; }
[Parameter("Last Price Marker?", DefaultValue = true)]
public bool PriceMarker { get; set; }
[Parameter("Marker Color", DefaultValue = "Red")]
public string MarkerColor { get; set; }
[Parameter("Marker Type (1-9)", DefaultValue = 1, MinValue = 1, MaxValue = 9)]
public int MarkerType { get; set; }
public string[] Markers = new string[10]
{
"",
" â",
" â",
" â",
" â¦",
" â",
" â",
" ã",
" ã",
" â"
};
public int BarThickness;
public double Stepsize;
public int Steps;
// The following two variables optimize the appearance of the HL Volume Bars
// through the volume bounds they operate in, expressed as percentiles of occurences.
// It uses the Ecel parameter denomination (0..1)
public double PercentileUpperBound = 0.98;
public double PercentileLowerBound = 0.1;
//----------------------------
protected override void Initialize()
{
//Calculate once - not on every tick
Steps = MaxBarThickness - MinBarThickness;
Stepsize = (PercentileUpperBound - PercentileLowerBound) / Steps;
}
//----------------------------
public override void Calculate(int index)
{
if (VolumeBars && index > Lookback + 1)
{
double[] tempVolumeSeries = new double[Lookback];
for (int i = Lookback; i > 0; i--)
{
tempVolumeSeries[Lookback - i] = MarketSeries.TickVolume[(index - 1) - i];
}
double LowerPerc = Percentile(tempVolumeSeries, PercentileLowerBound);
double UpperPerc = Percentile(tempVolumeSeries, PercentileUpperBound);
if (MarketSeries.TickVolume[index] >= LowerPerc && MarketSeries.TickVolume[index] < UpperPerc)
{
double x = PercentileLowerBound;
for (int i = MinBarThickness; i < MaxBarThickness + 1; i++)
{
if (MarketSeries.TickVolume[index] >= Percentile(tempVolumeSeries, x))
x += Stepsize;
else
{
BarThickness = i;
break;
}
}
}
else if (MarketSeries.TickVolume[index] >= UpperPerc)
BarThickness = MaxBarThickness;
else
BarThickness = MinBarThickness;
}
else
BarThickness = MinBarThickness;
ChartObjects.DrawLine(string.Format("Linie{0}", index), index, MarketSeries.High[index], index, MarketSeries.Low[index], (Colors)Enum.Parse(typeof(Colors), BarColor, true), BarThickness, LineStyle.Solid);
// The drawing of the Current Price Marker
if (IsLastBar && PriceMarker)
{
ChartObjects.DrawText("Triangle", Markers[MarkerType], index, MarketSeries.Close[index], VerticalAlignment.Center, HorizontalAlignment.Right, (Colors)Enum.Parse(typeof(Colors), MarkerColor, true));
}
}
//----------------------------
// A big thank you to Marco from
//
// http://stackoverflow.com/questions/8137391/percentile-calculation
//
// for the following code to calculate the percentiles:
public double Percentile(double[] sequence, double excelPercentile)
{
Array.Sort(sequence);
int N = sequence.Length;
double n = (N - 1) * excelPercentile + 1;
// Another method: double n = (N + 1) * excelPercentile;
if (n == 1.0)
return sequence[0];
else if (n == N)
return sequence[N - 1];
else
{
int k = (int)n;
double d = n - k;
return sequence[k - 1] + d * (sequence[k] - sequence[k - 1]);
}
}
}
}
9600302
Joined on 19.03.2015
- Distribution: Free
- Language: C#
- Trading platform: cTrader Automate
- File name: HL Volume Bars.algo
- Rating: 0
- Installs: 3503
- Modified: 13/10/2021 09:54

What's in the box?