Description
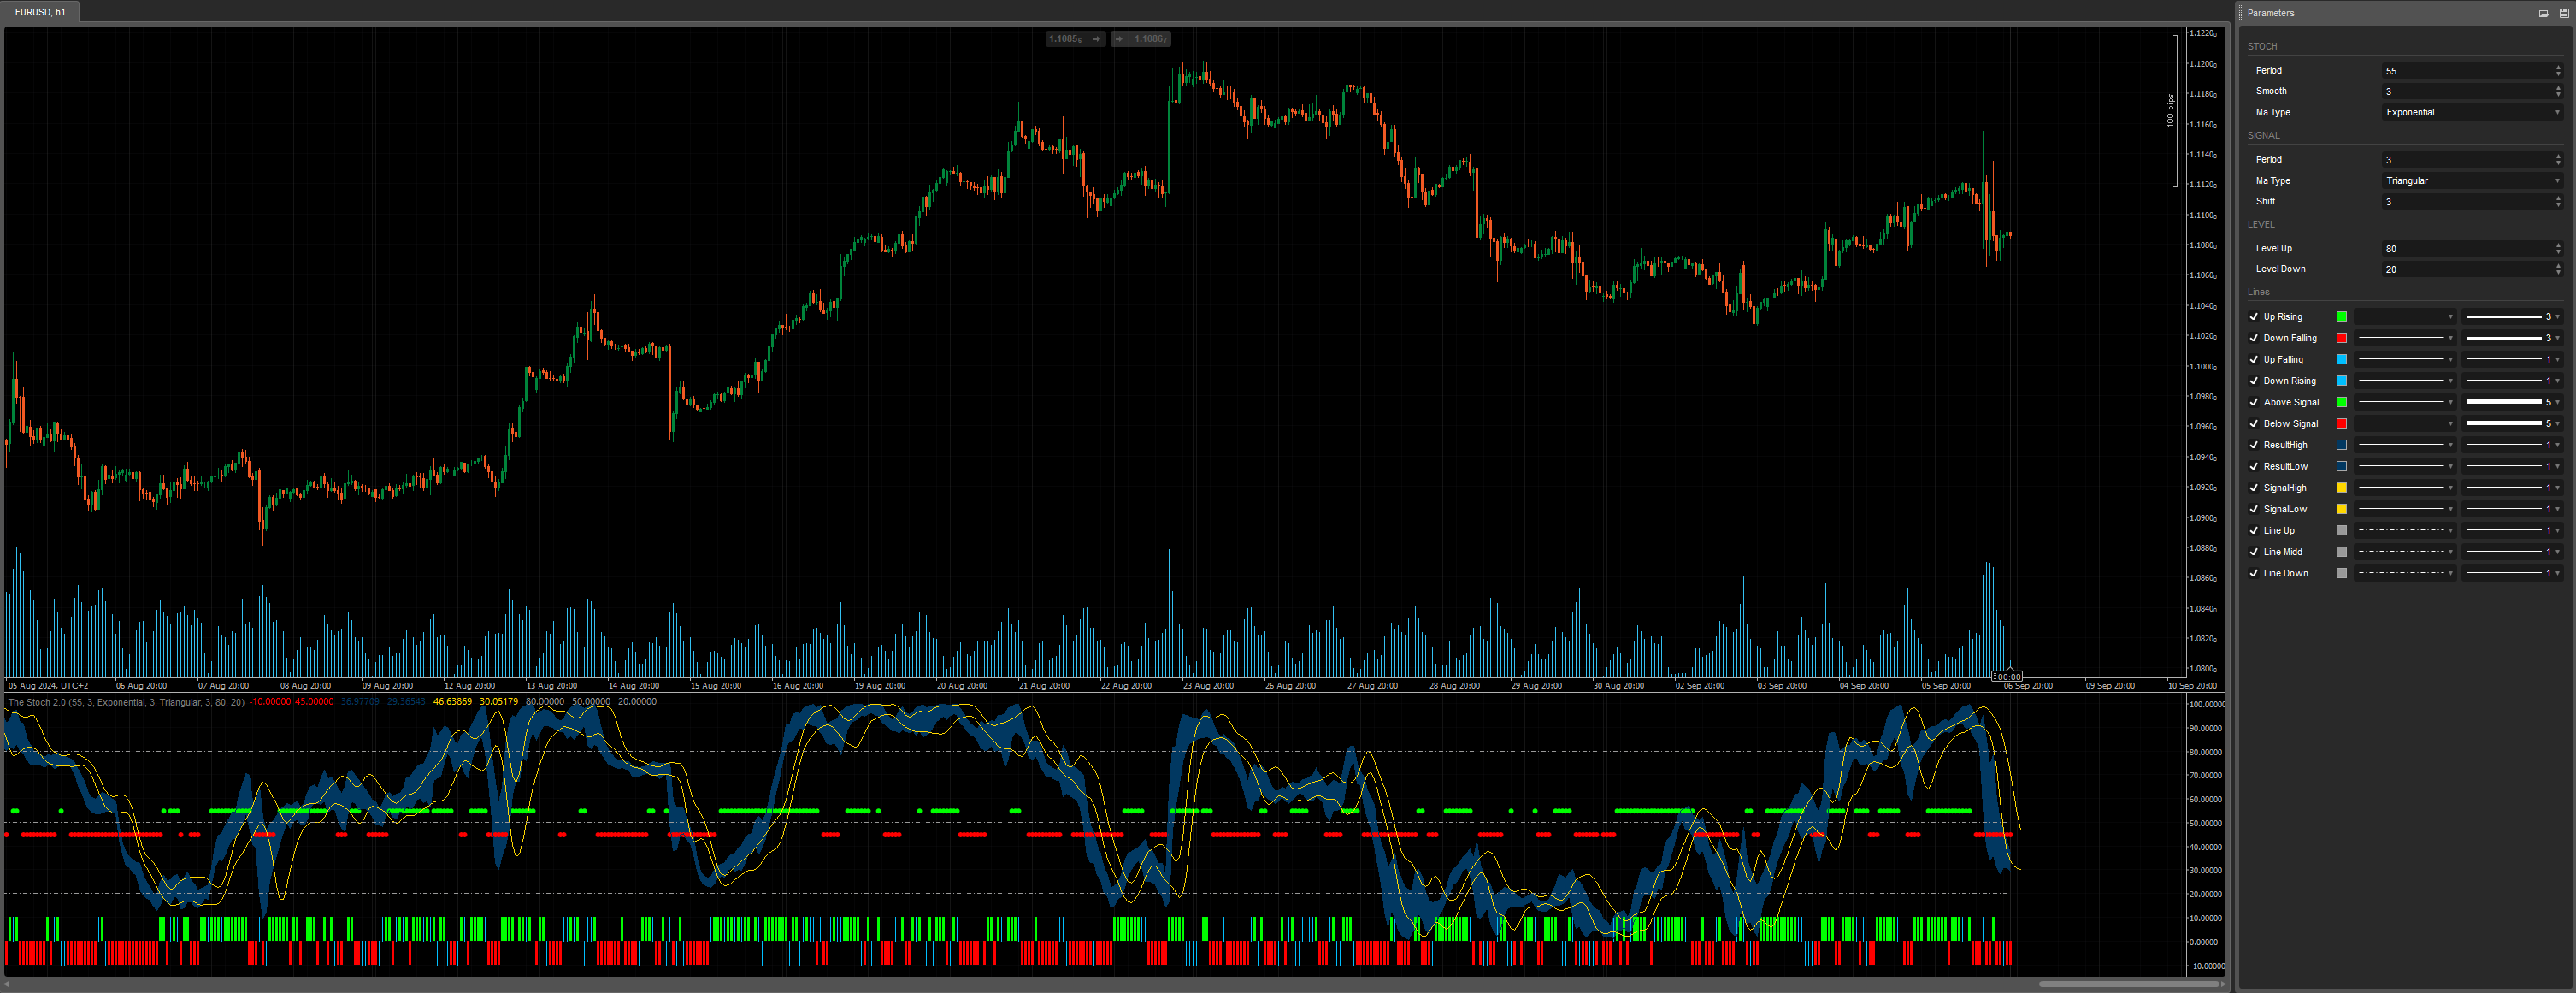
Introducing The Stoch v2.0 : A Custom Stochastic Indicator for cTrader
The The Stoch v2.0 is a custom stochastic indicator designed to provide more clarity on market highs and lows by filtering out false signals commonly encountered with traditional stochastic indicators. By introducing unique smoothing mechanisms and signal overlays, this tool helps traders identify trends and market reversals with greater precision.
How It Works
TheStoch20 operates similarly to traditional stochastic indicators, but with added features to enhance accuracy. It calculates overbought and oversold conditions by comparing the closing price to a range of highs and lows over a specified period. The indicator then applies smoothing to reduce noise, making it easier to spot genuine market shifts.
Key Features:
K-Period and D-Period
- The K-Period (default: 55) represents the number of bars used to calculate the stochastic, while the D-Period (default: 3) smoothens the K-Period values using the moving average.
- The K and D values are further refined with two types of moving averages: Exponential and Triangular.
Signal Shift
- The Shift parameter (default: 3) offsets the signal lines, helping traders visualize potential future changes and prepare for upcoming market movements.
Result and Signal Clouds
- ResultHigh and ResultLow display the smoothed stochastic results, helping traders gauge when the market is reaching a high or low.
- SignalHigh and SignalLow offer another layer of smoothing, creating signal clouds to indicate potential entry and exit points.
Level Lines
- The LevelUp and LevelDown parameters create horizontal lines at 8 and 20, respectively. These lines indicate overbought and oversold regions, helping you identify potential reversal points.
Histogram Visualization
- The histogram visually indicates whether the Result Cloud is rising, falling, or showing mixed signals. This allows traders to see trends at a glance:
- Up Rising (Lime): The Result Cloud is consistently rising.
- Down Falling (Red): The Result Cloud is falling.
- Up Falling (DeepSkyBlue): The high is rising while the low is falling.
- Down Rising (DeepSkyBlue): The high is falling while the low is rising.
Signal Points
- Above Signal and Below Signal markers highlight when the Result Cloud is above or below the signal lines, indicating strong buy or sell signals.
How to Use TheStoch20
Identifying Trends: The cloud system, combined with the histogram, helps you identify whether the market is in an uptrend, downtrend, or showing mixed signals.
Spotting Reversals: Pay attention to the LevelUp and LevelDown zones. When the stochastic values approach these levels, it may signal a potential reversal.
Timing Your Trades: Use the signal clouds to align your trades. If the ResultHigh and ResultLow are both above the SignalHigh and SignalLow, it indicates a potential buy signal. Conversely, if the result lines are below the signal lines, it may be time to sell.
Conclusion
TheStoch20 offers a nuanced approach to understanding market conditions. Its unique blend of smoothing techniques, cloud systems, and histogram visualizations provide traders with a clearer picture of price action. By filtering out noise and focusing on key signals, this indicator helps you make more informed trading decisions on the cTrader platform.
You can customize TheStoch20 by adjusting the periods, smoothing methods, and signal shifts to suit your trading strategy. Whether you're a beginner or an advanced trader, this tool will give you greater confidence when navigating market highs and lows.
Telegram group : https://t.me/cTraderStrategyTesterProject
GitHub : https://github.com/YesOrNotCtrader/Ctrader-Stragegy-Tester-Project
Enjoy for Free =)
Previous account here : https://ctrader.com/users/profile/70920
Contact telegram : https://t.me/nimi012
using System;
using System.Collections.Generic;
using System.Linq;
using System.Text;
using cAlgo.API;
using cAlgo.API.Collections;
using cAlgo.API.Indicators;
using cAlgo.API.Internals;

namespace cAlgo
{
    [Cloud("ResultHigh", "ResultLow", Opacity = 100)]
    [Indicator(IsOverlay = false, AccessRights = AccessRights.None)]
    public class TheStoch20 : Indicator
    {
        [Parameter("Period", DefaultValue = 55, Group = "STOCH")]
        public int KPeriod { get; set; }
        [Parameter("Smooth", DefaultValue = 3, Group = "STOCH")]
        public int KSlowing { get; set; }
        [Parameter("Ma Type", DefaultValue = MovingAverageType.Exponential, Group = "STOCH")]
        public MovingAverageType KSlowingMaType { get; set; }
        [Parameter("Period", DefaultValue = 3, Group = "SIGNAL")]
        public int DPeriod { get; set; }
        [Parameter("Ma Type", DefaultValue = MovingAverageType.Triangular, Group = "SIGNAL")]
        public MovingAverageType DPeriodMaType { get; set; }
        [Parameter("Shift", DefaultValue = 3, Group = "SIGNAL")]
        public int Shift { get; set; }

        [Parameter("Level Up", DefaultValue = 80, Group = "LEVEL")]
        public int LevelUp { get; set; }
        [Parameter("Level Down", DefaultValue = 20, Group = "LEVEL")]
        public int LevelDown { get; set; }

        [Output("Up Rising", IsHistogram = true, LineColor = "Lime", Thickness = 3)]
        public IndicatorDataSeries UpRising { get; set; }
        [Output("Down Falling", IsHistogram = true, LineColor = "Red", Thickness = 3)]
        public IndicatorDataSeries DownFalling { get; set; }
        [Output("Up Falling", IsHistogram = true, LineColor = "DeepSkyBlue", Thickness = 1)]
        public IndicatorDataSeries UpFalling { get; set; }
        [Output("Down Rising", IsHistogram = true, LineColor = "DeepSkyBlue", Thickness = 1)]
        public IndicatorDataSeries DownRising { get; set; }
        [Output("Above Signal", PlotType = PlotType.Points, LineColor = "Lime", Thickness = 5)]
        public IndicatorDataSeries AboveSignal { get; set; }
        [Output("Below Signal", PlotType = PlotType.Points, LineColor = "Red", Thickness = 5)]
        public IndicatorDataSeries BelowSignal { get; set; }

        [Output("ResultHigh", LineColor = "FF013861", Thickness = 1)]
        public IndicatorDataSeries ResultHigh { get; set; }
        [Output("ResultLow", LineColor = "FF013861", Thickness = 1)]
        public IndicatorDataSeries ResultLow { get; set; }
        [Output("SignalHigh", LineColor = "Gold", Thickness = 1)]
        public IndicatorDataSeries SignalHigh { get; set; }
        [Output("SignalLow", LineColor = "Gold", Thickness = 1)]
        public IndicatorDataSeries SignalLow { get; set; }

        [Output("Line Up", PlotType = PlotType.Line, LineStyle = LineStyle.LinesDots, LineColor = "FF999999", Thickness = 1)]
        public IndicatorDataSeries LineUp { get; set; }
        [Output("Line Midd", PlotType = PlotType.Line, LineStyle = LineStyle.LinesDots, LineColor = "FF999999", Thickness = 1)]
        public IndicatorDataSeries LineMidd { get; set; }
        [Output("Line Down", PlotType = PlotType.Line, LineStyle = LineStyle.LinesDots, LineColor = "FF999999", Thickness = 1)]
        public IndicatorDataSeries LineDown { get; set; }

        private IndicatorDataSeries highData,  lowData;
        private MovingAverage kslowHigh, kslowLow, DslowHigh, DslowLow;

        protected override void Initialize()
        {
            highData = CreateDataSeries();
            lowData = CreateDataSeries();

            kslowHigh = Indicators.MovingAverage(highData, KSlowing, KSlowingMaType);
            kslowLow = Indicators.MovingAverage(lowData, KSlowing, KSlowingMaType);
            DslowHigh = Indicators.MovingAverage(kslowHigh.Result, DPeriod, DPeriodMaType);
            DslowLow = Indicators.MovingAverage(kslowLow.Result, DPeriod, DPeriodMaType);
        }

        public override void Calculate(int index)
        {
            //Level Lines
            LineUp[index] = LevelUp;
            LineMidd[index] = 50;
            LineDown[index] = LevelDown;

            //High/Low Datas
            highData[index] = (Bars.HighPrices.Last(0) - Bars.LowPrices.Minimum(KPeriod)) / (Bars.HighPrices.Maximum(KPeriod) - Bars.LowPrices.Minimum(KPeriod)) * 100;
            lowData[index] = (Bars.LowPrices.Last(0) - Bars.LowPrices.Minimum(KPeriod)) / (Bars.HighPrices.Maximum(KPeriod) - Bars.LowPrices.Minimum(KPeriod)) * 100;

            //Result Cloud
            ResultHigh[index] = kslowHigh.Result.Last(0);
            ResultLow[index] = kslowLow.Result.Last(0);

            //Signal Cloud
            SignalHigh[index + Shift] = DslowHigh.Result.Last(0);
            SignalLow[index + Shift] = DslowLow.Result.Last(0);

            //Histogram : If RESULT CLOUD is Rising or Falling
            UpRising[index] = ResultHigh.IsRising() && ResultLow.IsRising() ? 10 : double.NaN;
            DownFalling[index] = ResultHigh.IsFalling() && ResultLow.IsFalling() ? -10 : double.NaN;
            UpFalling[index] = ResultHigh.IsRising() && ResultLow.IsFalling() ? 10 : double.NaN;
            DownRising[index] = ResultHigh.IsFalling() && ResultLow.IsRising() ? -10 : double.NaN;

            //Signal Point : If RESULT CLOUD is above or bellow SIGNAL LINES
            AboveSignal[index] = SignalHigh[index] < ResultHigh[index] && SignalLow[index] < ResultLow[index] ? 55 : double.NaN;
            BelowSignal[index] = SignalHigh[index] > ResultHigh[index] && SignalLow[index] > ResultLow[index] ? 45 : double.NaN;

        }
    }
}
YesOrNot2
Joined on 17.05.2024
- Distribution: Free
- Language: C#
- Trading platform: cTrader Automate
- File name: The Stoch 2.0.algo
- Rating: 5
- Installs: 947
- Modified: 08/09/2024 00:37
