Description
Main Objective
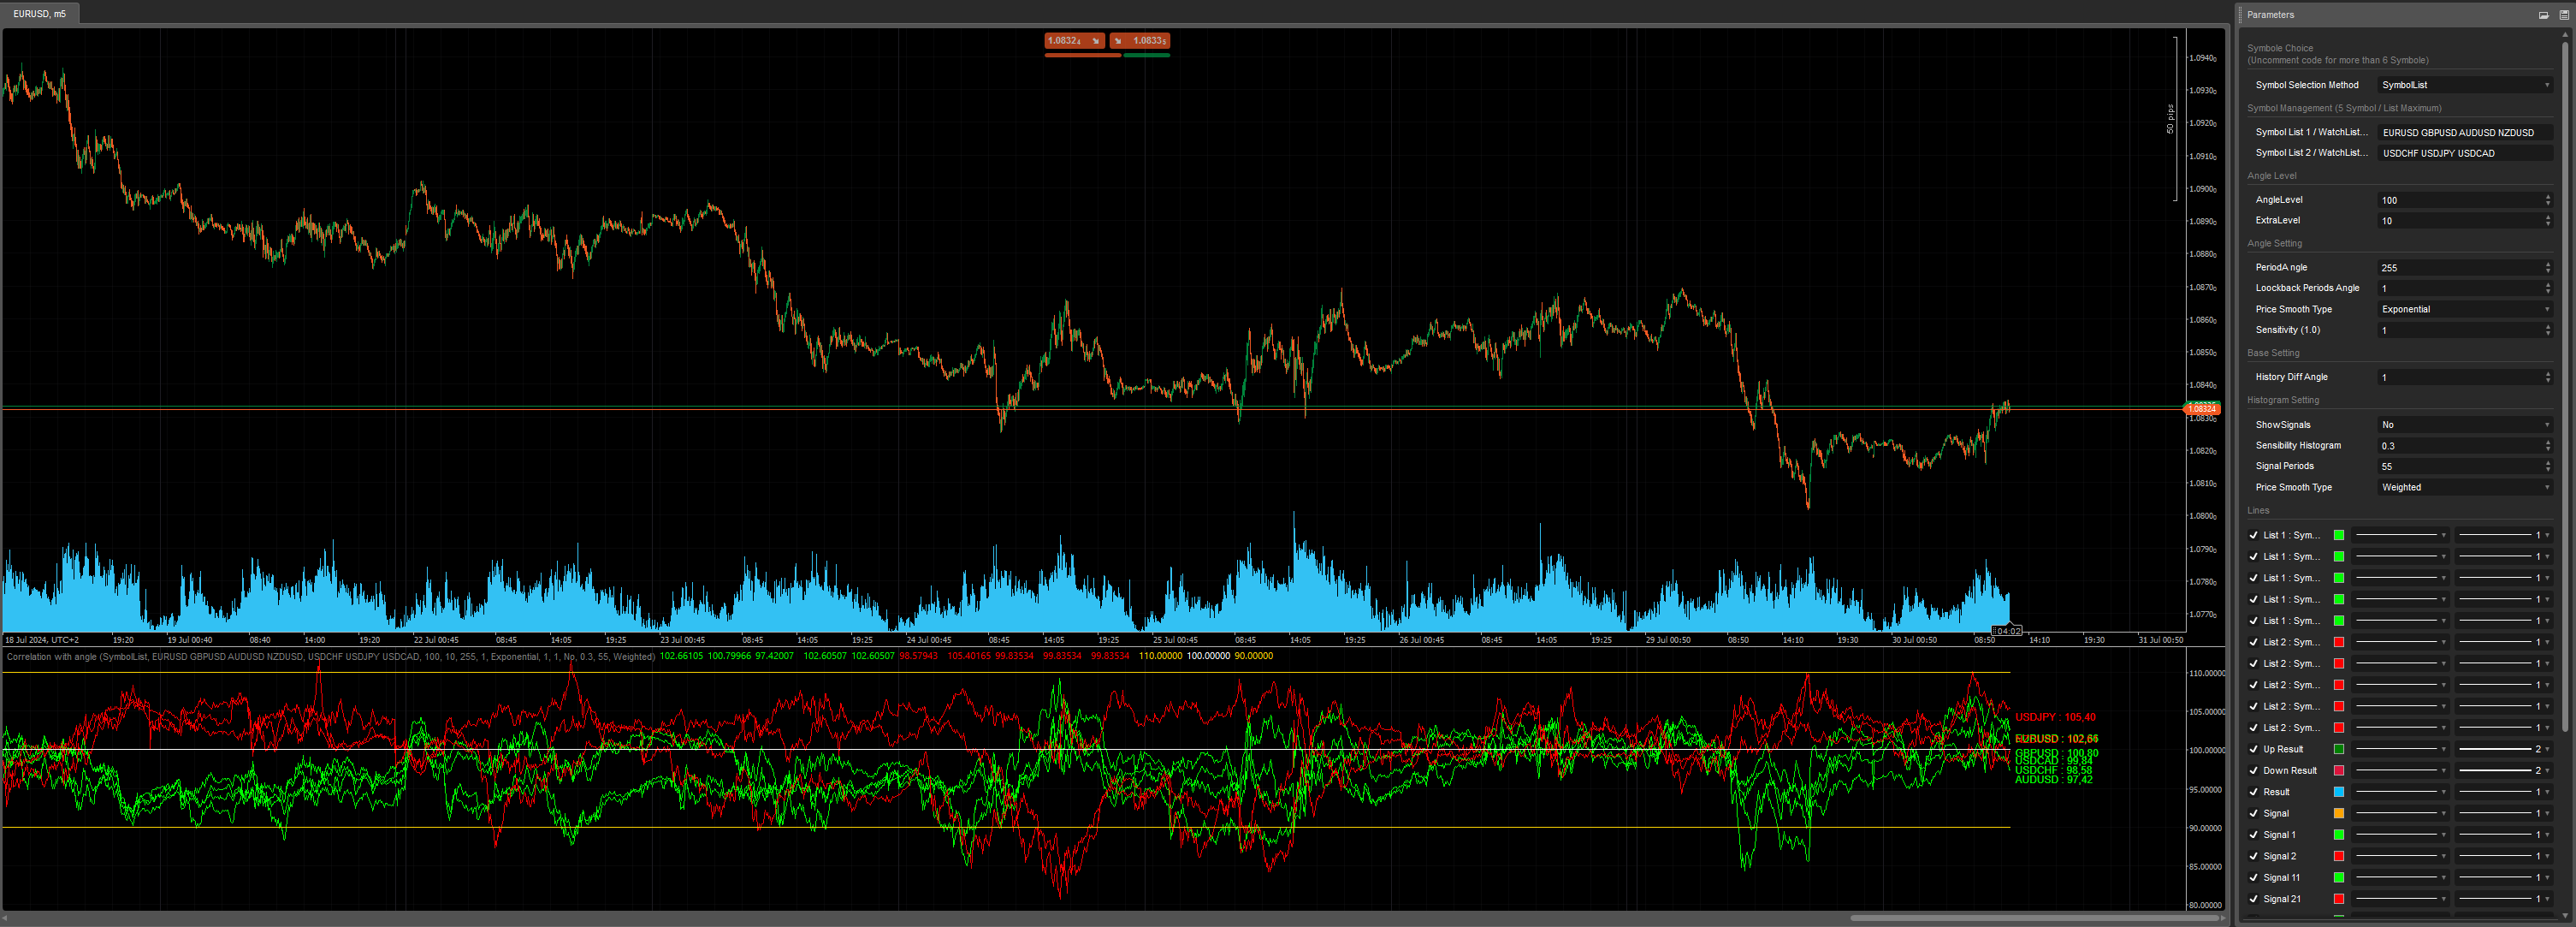
The "Correlationwithangle" indicator is designed to help traders identify correlations and angular movements between different currency symbols, using moving averages and volatility indicators like the ATR (Average True Range).
Key Features
Symbol Selection:
- The program allows selecting currency symbols to analyze from the current chart's symbol list, a WatchList, or a user-specified list of symbols.
Configuration Parameters:
- Various parameters allow configuring the angle of analysis, lookback periods, the type of moving average to use, and the sensitivity of the indicator.
Creation of Moving Averages and ATR:
- For each selected symbol, the indicator calculates a moving average and the ATR over a specified period. These indicators are used to determine the angles of price movements.
Display of Results:
- Calculation results are displayed as lines and histograms on the trading chart. Symbols from the first list are shown in green, while those from the second list are shown in red.
- Signals are generated to indicate when user-defined trading conditions are met.
How It Works
Initialization:
- During initialization (
Initialize), the program loads the chosen symbols' data (their historical prices) and creates the necessary moving averages and ATR for future calculations.
Angle Calculation:
- With each new data bar (
Calculate), the indicator calculates the angle of price movement for each symbol by comparing the current moving average with that of previous periods. The ATR is used to normalize these movements.
Signal Display:
- Results are displayed on the chart as lines and colored clouds to indicate bullish and bearish trends. User-defined angle levels are also displayed for reference.
Generation of Trading Signals:
- If specified conditions are met, trading signals (colored dots) are displayed to help the trader make decisions.
Utility
This indicator is useful for traders who want to:
- Analyze price movements across multiple symbols simultaneously.
- Identify correlations between different currency symbols.
- Visualize trends clearly through angular movements.
- Receive trading signals based on customized technical criteria.
In summary, this indicator helps traders make informed decisions by providing advanced technical analysis of price movements across multiple currency symbols.
Enjoy for Free =)
Previous account here : https://ctrader.com/users/profile/70920
Contact telegram : https://t.me/nimi012
using System;
using System.Linq;
using System.Threading;
using cAlgo.API;
using cAlgo.API.Indicators;
using cAlgo.API.Internals;
using cAlgo.Indicators;
using System.Collections.Generic;
using System.IO;
using System.Text;

namespace cAlgo
{
    //[Cloud("Fast Smooth", "Slow Smooth", FirstColor = "Green", SecondColor = "Red", Opacity = 0.1)]
    [Levels(0)]
    [Indicator(IsOverlay = false, TimeZone = TimeZones.UTC, AccessRights = AccessRights.None)]
    public class AngleOfMultiSymbol : Indicator
    {
        [Parameter("Symbol Selection Method", DefaultValue = SymbolSelectionMethodType.SymbolList, Group = "Symbole Choice \n(Uncomment code for more than 6 Symbole)")]
        public SymbolSelectionMethodType SymbolSelectionMethod { get; set; }
        [Parameter("Symbol List", DefaultValue = "EURUSD GBPUSD AUDUSD USDCHF", Group = "Symbole Choice \n(Uncomment code for more than 6 Symbole)")]
        public string TradedSymbols { get; set; }
        [Parameter("Watchlist Name", DefaultValue = "My Watchlist", Group = "Symbole Choice \n(Uncomment code for more than 6 Symbole)")]
        public string WatchlistName { get; set; }

        public enum SymbolSelectionMethodType
        {
            CurrentChart,
            SymbolList,
            WatchList
        }

        [Parameter("History Diff Angle", DefaultValue = 1, Group = "Base Setting")]
        public int HistoryTextLookback { get; set; }
        [Parameter("Tf", DefaultValue = "Hour1", Group = "Base Setting")]
        public TimeFrame Tf { get; set; }
        [Parameter("Price Smooth Period (255)", DefaultValue = 255, Group = "Angle Setting")]
        public int SmoothPeriods { get; set; }
        [Parameter("Price Smooth Type", DefaultValue = MovingAverageType.Weighted, Group = "Angle Setting")]
        public MovingAverageType MaType { get; set; }
        [Parameter("Loockback Periods Angle", DefaultValue = 1, Group = "Angle Setting")]
        public int LookbackPeriodsAngle { get; set; }
        [Parameter("Sensitivity (1.0)", DefaultValue = 1, Group = "Angle Setting")]
        public double Sensitivity { get; set; }

        [Output("Symb n° 1", LineColor = "White", PlotType = PlotType.Line, LineStyle = LineStyle.Solid, Thickness = 1)]
        public IndicatorDataSeries SymbN1 { get; set; }
        [Output("Symb n° 2", LineColor = "Lime", PlotType = PlotType.Line, LineStyle = LineStyle.Solid, Thickness = 1)]
        public IndicatorDataSeries SymbN2 { get; set; }
        [Output("Symb n° 3", LineColor = "Green", PlotType = PlotType.Line, LineStyle = LineStyle.Solid, Thickness = 1)]
        public IndicatorDataSeries SymbN3 { get; set; }
        [Output("Symb n° 4", LineColor = "DeepSkyBlue", PlotType = PlotType.Line, LineStyle = LineStyle.Solid, Thickness = 1)]
        public IndicatorDataSeries SymbN4 { get; set; }
         [Output("Symb n° 5", LineColor = "Red", PlotType = PlotType.Line, LineStyle = LineStyle.Solid, Thickness = 1)]
        public IndicatorDataSeries SymbN5 { get; set; }
        [Output("Symb n° 6", LineColor = "Magenta", PlotType = PlotType.Line, LineStyle = LineStyle.Solid, Thickness = 1)]
        public IndicatorDataSeries SymbN6 { get; set; }

        /*Uncomment For more Symbole on the chart
          [Output("Symb n° 7", LineColor = "Green", PlotType = PlotType.Line, LineStyle = LineStyle.Solid, Thickness = 1)]
          public IndicatorDataSeries SymbN7 { get; set; }
          [Output("Symb n° 8", LineColor = "DeepSkyBlue", PlotType = PlotType.Line, LineStyle = LineStyle.Solid, Thickness = 1)]
          public IndicatorDataSeries SymbN8 { get; set; }
          [Output("Symb n° 9", LineColor = "Red", PlotType = PlotType.Line, LineStyle = LineStyle.Solid, Thickness = 1)]
          public IndicatorDataSeries SymbN9 { get; set; }
          [Output("Symb n° 10", LineColor = "Magenta", PlotType = PlotType.Line, LineStyle = LineStyle.Solid, Thickness = 1)]
          public IndicatorDataSeries SymbN10 { get; set; }
        */

        private MovingAverage[] ma;
        private AverageTrueRange[] atr;

        private Symbol[] TradeList;
        private Bars[] bars;
        private IndicatorDataSeries[] Sources, ResSymbol;
        private int[] indexBars;

        protected override void Initialize()
        {
            if (SymbolSelectionMethod == SymbolSelectionMethodType.WatchList)
            {
                // Get the trade list from the watchlist provided by the user
                foreach (Watchlist w in Watchlists)
                {
                    if (w.Name == WatchlistName)
                    {
                        TradeList = Symbols.GetSymbols(w.SymbolNames.ToArray());
                    }
                }
            }
            else if (SymbolSelectionMethod == SymbolSelectionMethodType.SymbolList)
            {
                // Get the trade list from the sysmbol list provided by the user
                string[] SymbolList = TradedSymbols.ToUpper().Split(' ');

                TradeList = Symbols.GetSymbols(SymbolList);
            }
            else
            {
                TradeList = new Symbol[1];
                TradeList[0] = Symbol;
            }

            atr = new AverageTrueRange[TradeList.Length];
            ma = new MovingAverage[TradeList.Length];
            bars = new Bars[TradeList.Length];
            indexBars = new int[TradeList.Length];
            Sources = new IndicatorDataSeries[TradeList.Length];
            ResSymbol = new IndicatorDataSeries[TradeList.Length];

            Print("{0} traded symbols: ", TradeList.Length);

            int i = 0;
            foreach (var symbol in TradeList)
            {
                Print(symbol.Name);

                bars[i] = MarketData.GetBars(Tf, symbol.Name);
                if (bars[i].OpenTimes[0] > Bars.OpenTimes[0])
                    bars[i].LoadMoreHistory();
                //Load indicators on start up EP5-ATR
                Sources[i] = CreateDataSeries();
                ResSymbol[i] = CreateDataSeries();
                atr[i] = Indicators.AverageTrueRange(bars[i], 500, MovingAverageType.Simple);

                ma[i] = Indicators.MovingAverage(Sources[i], SmoothPeriods, MaType);
                i++;
            }
        }

        public override void Calculate(int index)
        {
            if (index < SmoothPeriods)
                return;

            for (int i = 0; i < TradeList.Length; i++)
            {
                //indexBars[i] = GetIndexByDate(bars[i], Bars.OpenTimes[index]);

                indexBars[i] = bars[i].OpenTimes.GetIndexByTime(Bars.OpenTimes[index]);
                Sources[i][index] = bars[i].ClosePrices[indexBars[i]];
                ResSymbol[i][index] = GetCalculationSymbol(ma[i].Result[index], ma[i].Result[index - LookbackPeriodsAngle], atr[i].Result[indexBars[i]]);
            }

            SymbN1[index] = ResSymbol[0][index];
            SymbN2[index] = ResSymbol[1][index];
            SymbN3[index] = ResSymbol[2][index];
            SymbN4[index] = ResSymbol[3][index];
            SymbN5[index] = ResSymbol[4][index];
            SymbN6[index] = ResSymbol[5][index];

            /* Uncomment For More Symbols on chart
              SymbN7[index] = ResSymbol[2][index];
              SymbN8[index] = ResSymbol[3][index];
              SymbN9[index] = ResSymbol[4][index];
              SymbN10[index] = ResSymbol[5][index];
            */

            IndicatorArea.RemoveAllObjects();

            for (int i = 0; i < TradeList.Length; i++)
            {
                IndicatorArea.DrawText((TradeList[i]).ToString() + index, TradeList[i] + " : " + ResSymbol[i][index].ToString("F2"), index, ResSymbol[i][index], ResSymbol[i][index] > ResSymbol[i][index - HistoryTextLookback] ? Color.Lime : Color.Red);
            }

        }
        public double GetCalculationSymbol(double priceSmooth, double priceSmoothLoockBack, double atr)
        {
            var _momentumpositive = priceSmooth - priceSmoothLoockBack;
            var _momentumnegative = priceSmoothLoockBack - priceSmooth;
            var _momentum = priceSmooth > priceSmoothLoockBack
                         ? _momentumpositive / atr
                         : _momentumnegative / atr;
            var _hypothenuse = Math.Sqrt((_momentum * _momentum) + (LookbackPeriodsAngle * LookbackPeriodsAngle));
            var _cos = (LookbackPeriodsAngle / _hypothenuse);
            var _angle = priceSmooth > priceSmoothLoockBack
                         ? (0 + (Math.Acos(_cos) * 100)) * Sensitivity
                         : (0 - (Math.Acos(_cos) * 100)) * Sensitivity;
            return _angle;
        }
    }
}
YesOrNot2
Joined on 17.05.2024
- Distribution: Free
- Language: C#
- Trading platform: cTrader Automate
- File name: Correlation with angle.algo
- Rating: 5
- Installs: 380
- Modified: 30/07/2024 10:46

I've commented before on previous algo shares of yours, but just wanted to say it again.. THANKS for taking the time and effort to share these very useful fully functioning examples, which you share without need for praise, nor payment. A real bonus to the community.
+5