Description
Explanation of the Code: Bollinger Angle Squeez Indicator
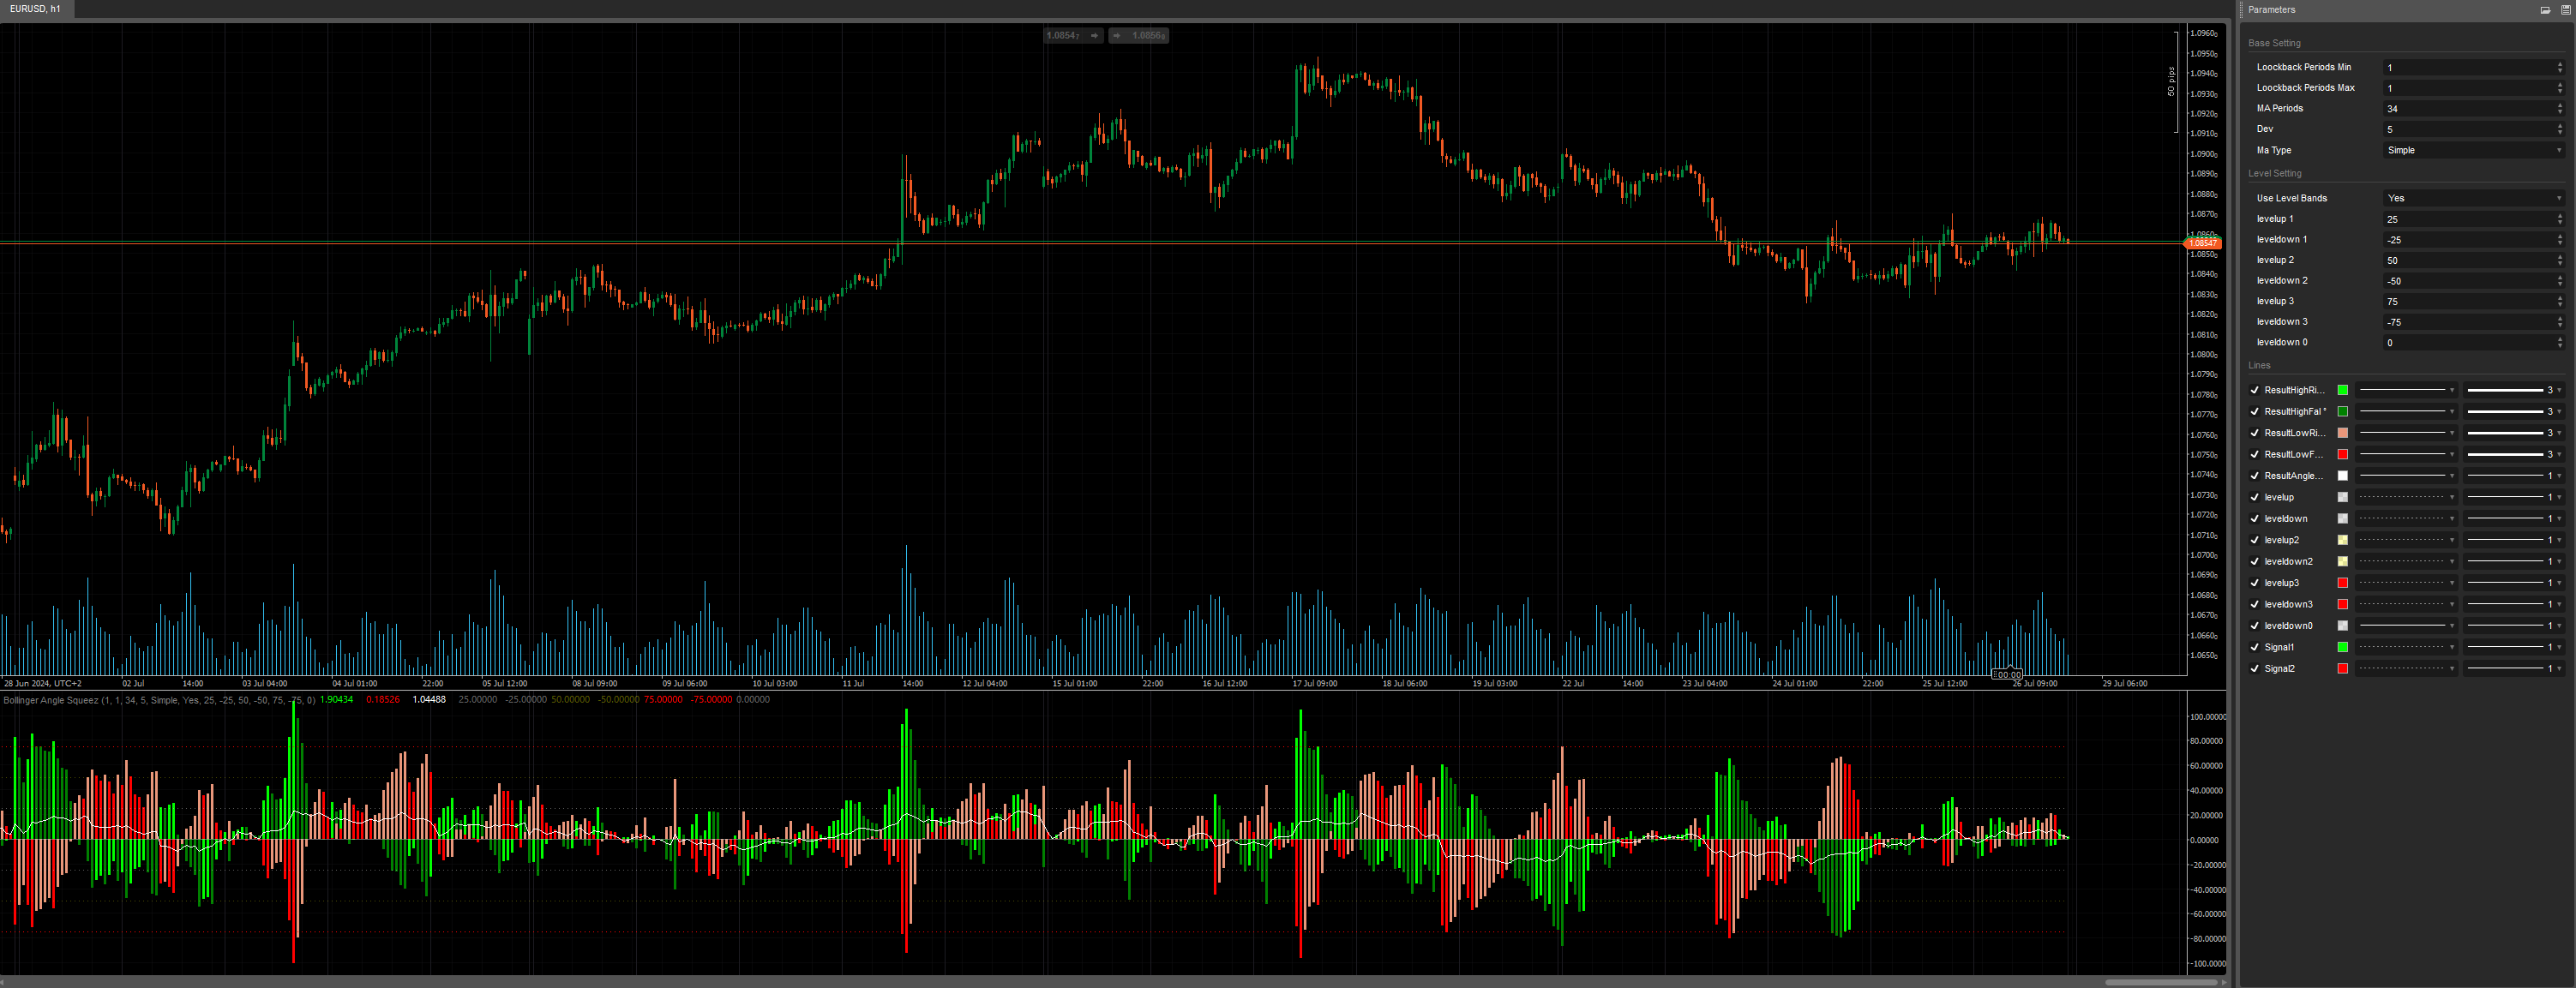
This code is a custom trading indicator designed for use on the cTrader trading platform. It analyzes market data to identify trends and potential trading opportunities based on Moving Averages and Bollinger Bands. Here’s a simple breakdown of what the code does:
Key Concepts:
- Indicators: Tools used in technical analysis to predict future market movements.
- Moving Average (MA): An average of price data over a specific period, used to smooth out price trends.
- Bollinger Bands: A volatility indicator that plots three lines – a middle band (moving average), an upper band (moving average + standard deviation), and a lower band (moving average - standard deviation).
- Average True Range (ATR): An indicator that measures market volatility.
What the Code Does:
Parameters Setup:
- LoockbackPeriods: The minimum number of periods to look back for calculations.
- LoockbackPeriodsMax: The maximum number of periods to look back.
- Periods: The number of periods used to calculate the moving average.
- Dev: The deviation used for the Bollinger Bands.
- MaType: The type of moving average to use (Simple, Exponential, etc.).
- UseLevel: Whether to use predefined levels for additional analysis.
- LevelupSet, Levelup2Set, Levelup3Set: Predefined levels for additional analysis.
Outputs:
- ResultHighRis, ResultHighFal, ResultLowRis, ResultLowFal: Histograms showing whether the top or bottom Bollinger Bands are rising or falling.
- ResultAngleBoll: Line showing the angle of the main Bollinger Band.
- Level Indicators: Lines showing the predefined levels on the chart.
Initialization:
- The code initializes Bollinger Bands and the Average True Range (ATR) indicators.
- It also prepares data series to store intermediate and final results.
Calculation:
- For each new data point (index):
- Calculate Angles: Determine the angle of the top, bottom, and main Bollinger Bands using the
GetCalculationAnglemethod. This method calculates the angle based on the difference in price over the lookback periods and the ATR. - Determine Rising or Falling: Check if the Bollinger Bands are rising or falling and store the results accordingly.
- Set Levels: If the
UseLevelparameter is enabled, set the predefined levels on the chart.
- Calculate Angles: Determine the angle of the top, bottom, and main Bollinger Bands using the
GetCalculationAngle Method:
- This method calculates the angle of a price series (e.g., Bollinger Bands) over the specified lookback periods.
- It uses trigonometry to determine the angle, considering the ATR as a measure of price movement.
How It Helps Traders:
This indicator helps traders understand market trends by analyzing the angles of Bollinger Bands and determining whether they are rising or falling. It uses moving averages to smooth out price data and calculates angles based on historical price movements and volatility (ATR). The results are visualized on the trading chart with various colors and lines to help traders make informed decisions.
Identifying Starting Range Zone and Exit Range Zones:
One of the main benefits of this indicator is that it makes it much easier to identify entry and exit zones in ranging markets. Here's how:
- Range Zones: The indicator highlights when the market is in a range (sideways movement), making it easier to identify potential entry points where the price is likely to bounce back within the range.
- Squeez Zones: Similarly, it also identifies when the market is about to break out of the range, indicating potential exit points to avoid false breakouts or to capitalize on new trends.
By clearly showing when the Bollinger Bands are rising or falling and providing levels for additional analysis, the AngleMATrendForce302 indicator simplifies the process of detecting these critical zones, helping traders to optimize their strategies and improve their trading decisions.
Enjoy for Free =)
Previous account here : https://ctrader.com/users/profile/70920
Contact telegram : https://t.me/nimi012
using System;
using System.Collections.Generic;
using System.Linq;
using System.Text;
using cAlgo.API;
using cAlgo.API.Collections;
using cAlgo.API.Indicators;
using cAlgo.API.Internals;


namespace cAlgo
{
    [Indicator(IsOverlay = false, TimeZone = TimeZones.UTC, AccessRights = AccessRights.None)]
    public class BollingerAngleSqueez : Indicator
    {
        [Parameter("Loockback Periods Min", DefaultValue = 1, MinValue = 1, Group = "Base Setting")]
        public int LoockbackPeriods { get; set; }
        [Parameter("Loockback Periods Max", DefaultValue = 1, MinValue = 1, Group = "Base Setting")]
        public int LoockbackPeriodsMax { get; set; }
        [Parameter("MA Periods", DefaultValue = 34, MinValue = 1, Group = "Base Setting")]
        public int Periods { get; set; }
        [Parameter("Dev", DefaultValue = 5, Group = "Base Setting")]
        public double Dev { get; set; }
        [Parameter("Ma Type", DefaultValue = MovingAverageType.Simple, Group = "Base Setting")]
        public MovingAverageType MaType { get; set; }

        [Parameter("Use Level Bands", DefaultValue = "true", Group = "Level Setting")]
        public bool UseLevel { get; set; }
        [Parameter("levelup 1", DefaultValue = 25, MinValue = 0, Group = "Level Setting")]
        public int LevelupSet { get; set; }
        [Parameter("levelup 2", DefaultValue = 50, MinValue = 0, Group = "Level Setting")]
        public int Levelup2Set { get; set; }
        [Parameter("levelup 3", DefaultValue = 75, MinValue = 0, Group = "Level Setting")]
        public int Levelup3Set { get; set; }

        [Output("ResultHighRis °", PlotType = PlotType.Histogram, LineStyle = LineStyle.Solid, LineColor = "Lime", Thickness = 3)]
        public IndicatorDataSeries ResultHighRis { get; set; }
        [Output("ResultHighFal °", PlotType = PlotType.Histogram, LineStyle = LineStyle.Solid, LineColor = "Green", Thickness = 3)]
        public IndicatorDataSeries ResultHighFal { get; set; }
        [Output("ResultLowRis °", PlotType = PlotType.Histogram, LineStyle = LineStyle.Solid, LineColor = "DarkSalmon", Thickness = 3)]
        public IndicatorDataSeries ResultLowRis { get; set; }
        [Output("ResultLowFal °", PlotType = PlotType.Histogram, LineStyle = LineStyle.Solid, LineColor = "Red", Thickness = 3)]
        public IndicatorDataSeries ResultLowFal { get; set; }

        [Output("ResultAngleBoll °", PlotType = PlotType.Line, LineStyle = LineStyle.Solid, LineColor = "White", Thickness = 1)]
        public IndicatorDataSeries ResultAngleBoll { get; set; }

        [Output("levelup", LineColor = "7EC0C0C0", LineStyle = LineStyle.DotsRare, PlotType = PlotType.Line, Thickness = 1)]
        public IndicatorDataSeries levelup { get; set; }
        [Output("leveldown", LineColor = "7EC0C0C0", LineStyle = LineStyle.DotsRare, PlotType = PlotType.Line, Thickness = 1)]
        public IndicatorDataSeries leveldown { get; set; }
        [Output("levelup2", LineColor = "4AFFFF00", LineStyle = LineStyle.DotsRare, PlotType = PlotType.Line, Thickness = 1)]
        public IndicatorDataSeries levelup2 { get; set; }
        [Output("leveldown2", LineColor = "4AFFFF00", LineStyle = LineStyle.DotsRare, PlotType = PlotType.Line, Thickness = 1)]
        public IndicatorDataSeries leveldown2 { get; set; }
        [Output("levelup3", LineColor = "Red", LineStyle = LineStyle.DotsRare, PlotType = PlotType.Line, Thickness = 1)]
        public IndicatorDataSeries levelup3 { get; set; }
        [Output("leveldown3", LineColor = "Red", LineStyle = LineStyle.DotsRare, PlotType = PlotType.Line, Thickness = 1)]
        public IndicatorDataSeries leveldown3 { get; set; }
        [Output("leveldown0", LineColor = "7EC0C0C0", LineStyle = LineStyle.Solid, PlotType = PlotType.Line, Thickness = 1)]
        public IndicatorDataSeries leveldown0 { get; set; }

        private BollingerBands boll;
        private AverageTrueRange atr;
        private IndicatorDataSeries resTop, resBottom;

        protected override void Initialize()
        {
            boll = Indicators.BollingerBands(Bars.MedianPrices, Periods, Dev, MaType);
            atr = Indicators.AverageTrueRange(500, MovingAverageType.Simple);
            resTop = CreateDataSeries();
            resBottom = CreateDataSeries();
        }
        public override void Calculate(int index)
        {
            resTop[index] = GetCalculationAngle(boll.Top, index, atr.Result);
            resBottom[index] = GetCalculationAngle(boll.Bottom, index, atr.Result);

            ResultAngleBoll[index] = GetCalculationAngle(boll.Main, index, atr.Result);

            ResultHighRis[index] = resTop.IsRising() ? resTop[index] : double.NaN;
            ResultHighFal[index] = resTop.IsFalling() ? resTop[index] : double.NaN;

            ResultLowRis[index] = resBottom.IsRising() ? resBottom[index] : double.NaN;
            ResultLowFal[index] = resBottom.IsFalling() ? resBottom[index] : double.NaN;

            if (UseLevel)
            {
                levelup[index] = LevelupSet;
                levelup2[index] = Levelup2Set;
                levelup3[index] = Levelup3Set;
                leveldown0[index] = 0;
                leveldown[index] = -LevelupSet;
                leveldown2[index] = -Levelup2Set;
                leveldown3[index] = -Levelup3Set;
            }
        }
        public double GetCalculationAngle(DataSeries price, int index, DataSeries atr)
        {
            var res = 0.0;
            for (int i = 0; i < LoockbackPeriodsMax; i++)
            {

                var atrRange = atr[index - i];
                var CoteOpposePlus = ((price[index]) - (price[index - (LoockbackPeriods + i)]));
                var CoteOpposeMinus = (price[index - (LoockbackPeriods + i)]) - (price[index]);
                var CoteOppose = (price[index]) > (price[index - (LoockbackPeriods + i)]) ? CoteOpposePlus / atrRange : CoteOpposeMinus / atrRange;
                var Hypothenuse = Math.Sqrt((CoteOppose * CoteOppose) + (LoockbackPeriods + i) * (LoockbackPeriods + i));
                var cos = ((LoockbackPeriods + i) / Hypothenuse);
                res += (price[index]) > (price[index - (LoockbackPeriods + i)]) ? (0 + (Math.Acos(cos) * 100)) : (0 - (Math.Acos(cos) * 100));
            }
            return res / LoockbackPeriodsMax;
        }
    }
}
YesOrNot2
Joined on 17.05.2024
- Distribution: Free
- Language: C#
- Trading platform: cTrader Automate
- File name: Bollinger Angle Squeez.algo
- Rating: 5
- Installs: 407
- Modified: 27/07/2024 09:12
