Description
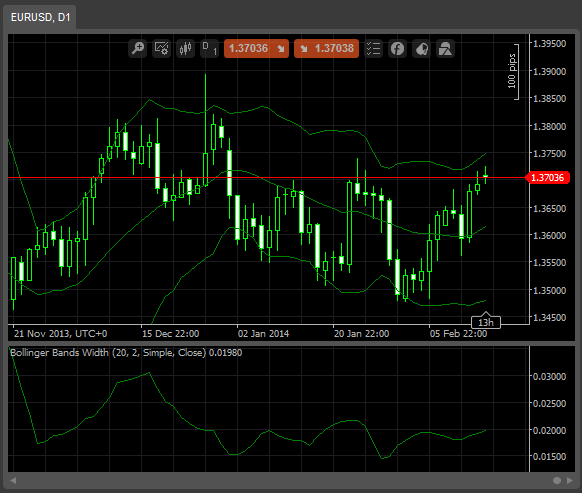
Bollinger Bands Width is a technical analysis indicator derived from the standard Bollinger Bands indicator. Bollinger Bands are a volatility indicator which creates a band of three lines which are plotted in relation to a security's price. The Middle Line is typically a 20 Day Simple Moving Average. The Upper and Lower Bands are typically 2 standard deviations above and below the SMA (Middle Line). Bollinger Bands Width serve as a way to quantitatively measure the width between the Upper and Lower Bands. BBW can be used to identify trading signals in some instances.
John Bollinger, introduced Bollinger Bands Width in 2010 almost 3 decades after the introduction of his Bollinger Bands.
u

modarkat
Joined on 25.12.2013
- Distribution: Free
- Language: C#
- Trading platform: cTrader Automate
- File name: Bollinger Bands Width.algo
- Rating: 0
- Installs: 6299
- Modified: 13/10/2021 09:54


Here is modified code. Coding seems easy in Calgo
Language: C#cAlgo , cTrader
Trading Platform:
{
[Indicator
{
[Parameter
[Parameter
[Parameter
[Parameter
[Output
{
_bollingerBands = Indicators
}
{
Diff[index] = (_bollingerBands.Top[index] - _bollingerBands.Bottom[index]) / _bollingerBands.Main[index];
}
}
}