Description
Download link: Kernel Functions Indicator – cTrader cBot
More free products: Products – cTrader cBot
What is the Kernel Functions Indicator?
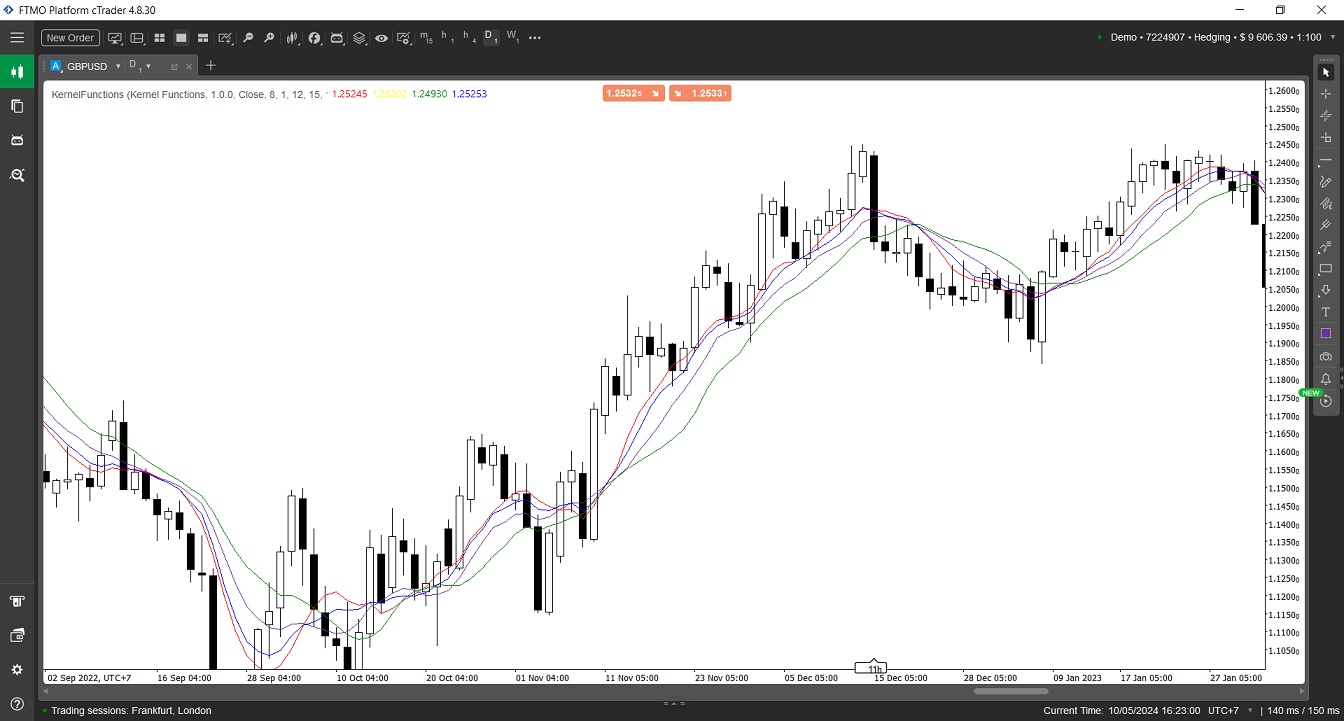
The Kernel Functions Indicator is a sophisticated tool designed to smooth out market data and help traders identify underlying trends or patterns. It leverages mathematical computations known as “kernel functions” to process price data and output various forms of moving averages. Each kernel function has a unique way of weighting historical data, thereby providing different perspectives on the market’s movements.
Features of the Kernel Functions Indicator
The indicator comes with several adjustable parameters, allowing traders to tailor it to their specific needs. These parameters include:
- Rational Quadratic Lookback: Determines the number of past bars to consider for the Rational Quadratic Kernel, which is a blend of Gaussian Kernels of different scales.
- Relative Weighting: Affects the Rational Quadratic Kernel’s emphasis on different time frames, offering a more flexible curve fitting.
- Gaussian Lookback: Sets the lookback period for the Gaussian Kernel, a classic choice for smoothing that uses the Radial Basis Function.
- Periodic Lookback and Period: These parameters are for the Periodic Kernel, designed to model functions that repeat at regular intervals, such as seasonal trends.
- Locally Periodic Lookback and Period: Combines the Periodic and Gaussian Kernels to model periodic functions that also change over time.
How Do the Kernels Work?
- Rational Quadratic Kernel: It provides a dynamic smoothing effect by combining multiple Gaussian Kernels. This results in a curve that can adapt to both short-term fluctuations and long-term trends.
- Gaussian Kernel: This kernel gives a more traditional smoothing, with recent prices having a more significant impact than older prices. It’s particularly useful for identifying the overall direction of the market.
- Periodic Kernel: By focusing on cyclical patterns, this kernel can be particularly valuable for markets with regular oscillations, such as commodities with seasonal price patterns.
- Locally Periodic Kernel: This hybrid kernel is ideal for markets where cyclical behavior is present but evolves over time, offering a nuanced view of periodic trends within a changing market context.
Applications for Traders
Traders can use the Kernel Functions Indicator to enhance their technical analysis in several ways:
- Trend Identification: By smoothing out price data, traders can more easily identify the underlying trend, which is essential for strategies that follow the trend.
- Cycle Analysis: For markets with known cycles, the Periodic and Locally Periodic Kernels can help traders anticipate recurring price movements.
- Volatility Assessment: The shape and smoothness of the curves produced by the kernels can give insights into market volatility. A more wiggly curve may indicate a more volatile market.
Conclusion
The Kernel Functions Indicator is a powerful addition to any trader’s toolkit on the cTrader platform. By understanding and utilizing the different kernels, traders can gain a deeper insight into market dynamics and refine their trading strategies accordingly. Whether you’re looking to smooth out price data, identify trends, or analyze cycles, the Kernel Functions Indicator offers a versatile solution for a wide range of trading scenarios.
The author decided to hide the source code.
mage
Joined on 22.05.2022
- Distribution: Free
- Language: C#
- Trading platform: cTrader Automate
- File name: DemoIndicator.algo
- Rating: 0
- Installs: 496
- Modified: 10/05/2024 09:34
