Description
Download Link: Fisher_m11 Indicator – cTrader cBot
The Fisher_m11 indicator is a technical analysis tool that traders can use on the cTrader platform to identify potential price reversals and trend continuations. This indicator applies the Fisher Transform mathematical formula to price data to help pinpoint major price moves and provide early signals for traders.
What is the Fisher Transform?
The Fisher Transform is an indicator created by John F. Ehlers that converts prices into a Gaussian normal distribution. The main purpose of the Fisher Transform is to make price movements clearer and to help signal turning points with greater accuracy.
How Does the Fisher_m11 Indicator Work?
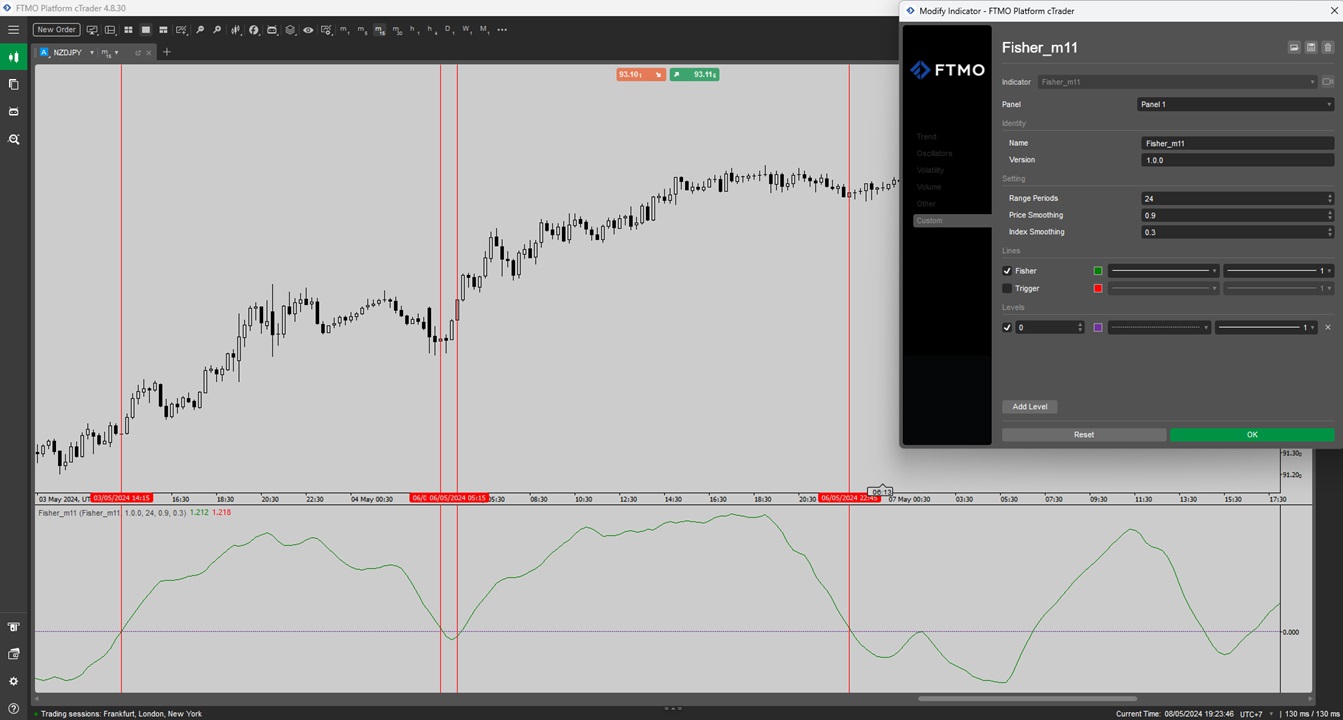
The Fisher_m11 indicator takes the midpoint of the high and low prices over a certain period, which you can adjust, and applies the Fisher Transform to these values. It creates two lines on a separate chart below the main price chart:
- Fisher Line (Green): This line represents the Fisher Transform values of the smoothed price series. It can help you identify when the price is reaching an extreme based on the historical prices within the chosen period.
- Trigger Line (Red): This line is a lagged version of the Fisher line, essentially showing where the Fisher line was the previous period. It’s used to confirm the signals given by the Fisher line.
Using the Fisher_m11 Indicator
When the Fisher line crosses above the Trigger line, it can be considered a bullish signal, suggesting that the price may be starting to move upwards. Conversely, when the Fisher line crosses below the Trigger line, it can be considered a bearish signal, indicating that the price may be starting to move downwards.
Moreover, when the Fisher line reaches extreme high or low values, it may suggest that the current trend is overextended and could be due for a reversal. However, it’s essential to note that no indicator is perfect, and false signals can occur.
Customizing the Indicator
The Fisher_m11 indicator on cTrader comes with customizable parameters:
- Range Periods: This setting allows you to choose the number of periods over which to calculate the high and low prices for the Fisher Transform. A higher number provides a broader view but may lag more, while a lower number is more responsive but might give more false signals.
- Price Smoothing: This parameter smooths out the price data before applying the Fisher Transform. A higher smoothing factor may lead to fewer false signals but at the cost of responsiveness.
- Index Smoothing: This setting smooths the Fisher Transform itself. Similar to price smoothing, a higher index smoothing factor will make the indicator less responsive but potentially more reliable.
Conclusion
The Fisher_m11 indicator for cTrader is a tool that can help traders identify potential changes in market direction earlier than some other indicators. By transforming price data into a normal distribution, the Fisher Transform aims to highlight when prices have moved to an extreme and may be due for a reversal.
As with any trading tool, it’s recommended to use the Fisher_m11 indicator as part of a comprehensive trading strategy, combining it with other forms of analysis and good risk management practices. Always remember to test any new indicator with historical data before applying it to live trading.
The author decided to hide the source code.
mage
Joined on 22.05.2022
- Distribution: Paid
- Language: C#
- Trading platform: cTrader Automate
- File name: cTrader.bot.algo
- Rating: 0
- Installs: 0
- Modified: 08/05/2024 12:40
