Warning! This section will be deprecated on February 1st 2025. Please move all your Indicators to the cTrader Store catalogue.
Description
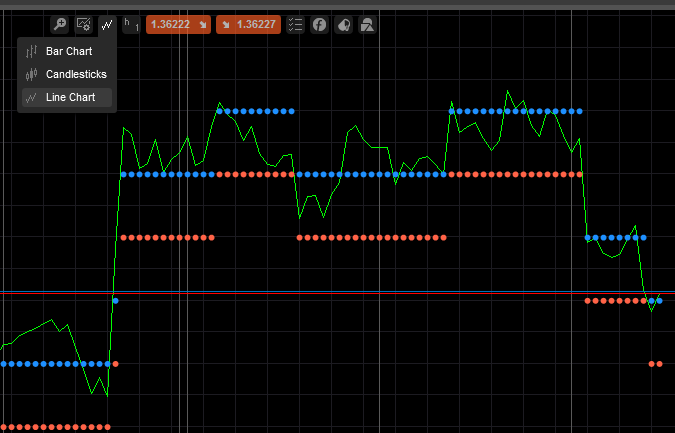
For those who like Renko: Simplified Renko. It is time based, simply because cAlgo/cTrader are time based. Simplified Renko however does show what a real Renko Chart shows: movement in blocks of a fixed pip size.
It shows clearly where area's of support and resistance are. In a real Renko chart all horizontal dotlines would be shown as one block only and blow chart would consist of no more than 10 blocks.
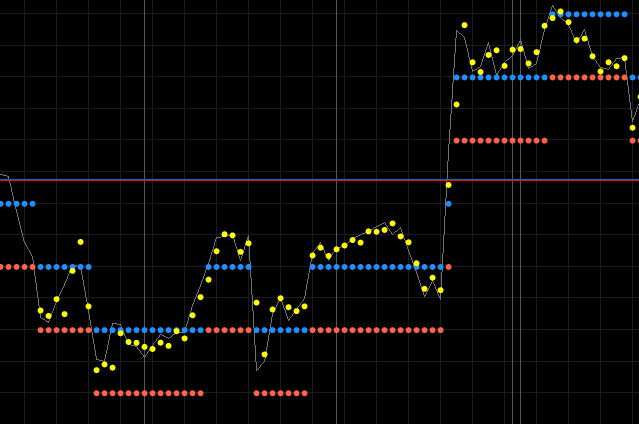
If combined with the Temporary Fair Value indicator, you can clearly see where the battle between bears and bulls take place and where price moments gets most resistance or support. The yellow dots in below image are the TFV indicator.
/

jeex
Joined on 18.10.2013
- Distribution: Free
- Language: C#
- Trading platform: cTrader Automate
- File name: JeexSimplifiedRenko.algo
- Rating: 5
- Installs: 5983
- Modified: 13/10/2021 09:54

Note that publishing copyrighted material is strictly prohibited. If you believe there is copyrighted material in this section, please use the Copyright Infringement Notification form to submit a claim.

Hi there. Thanks a lot for your hard work.
I'm a bit confused about how to read the indicator.
1. When to enter BUY positions and when close it?
2. Same about SELL
Cheers