Description
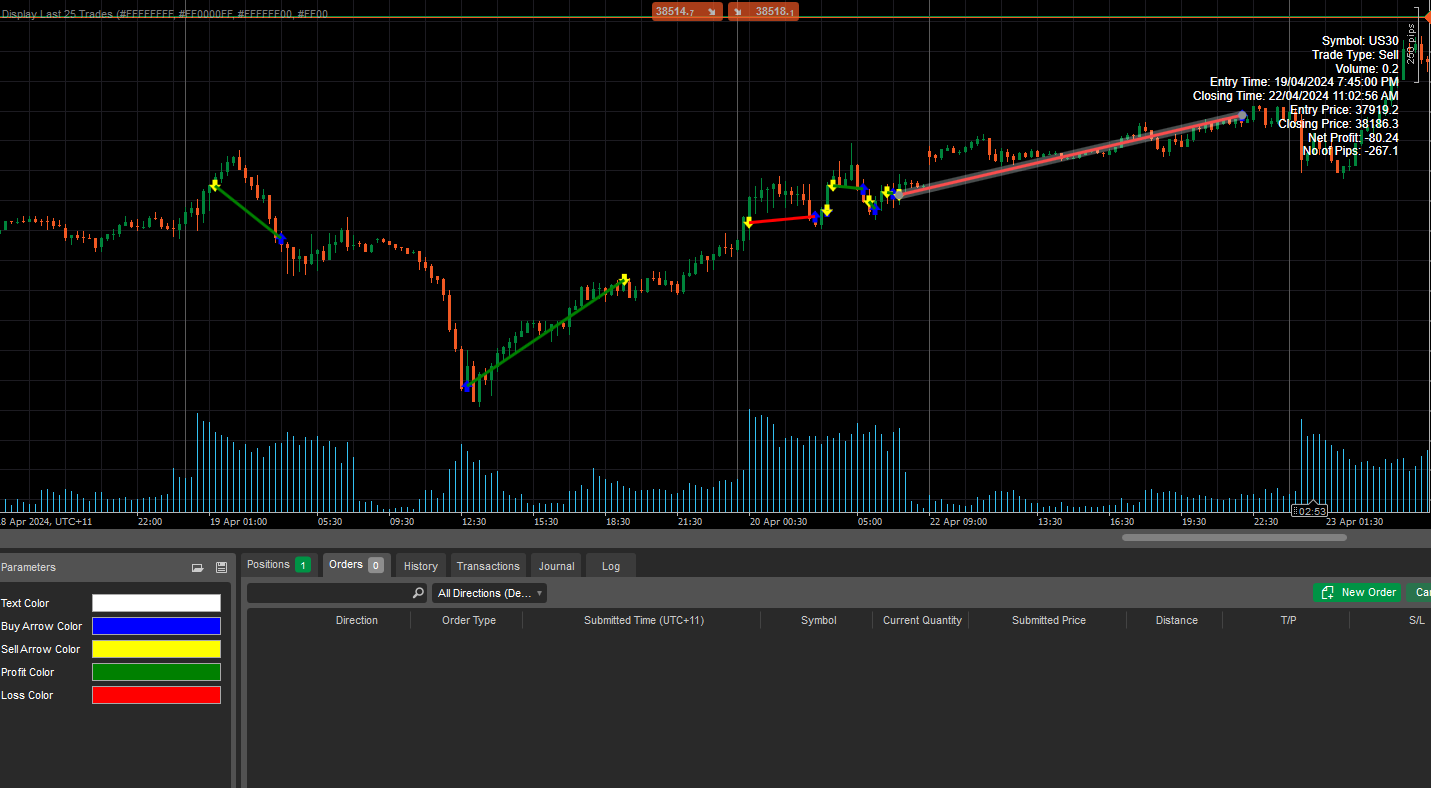
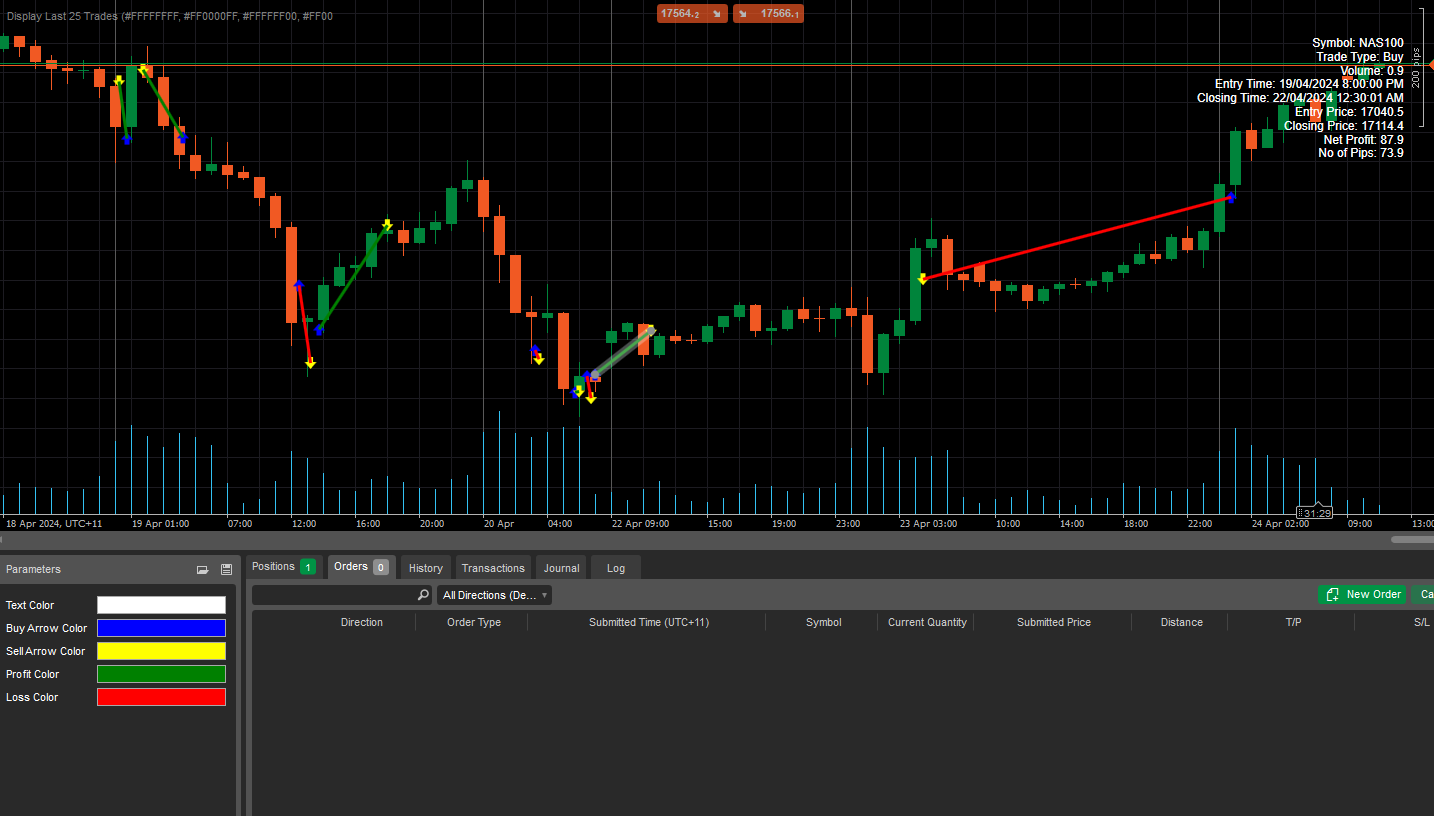
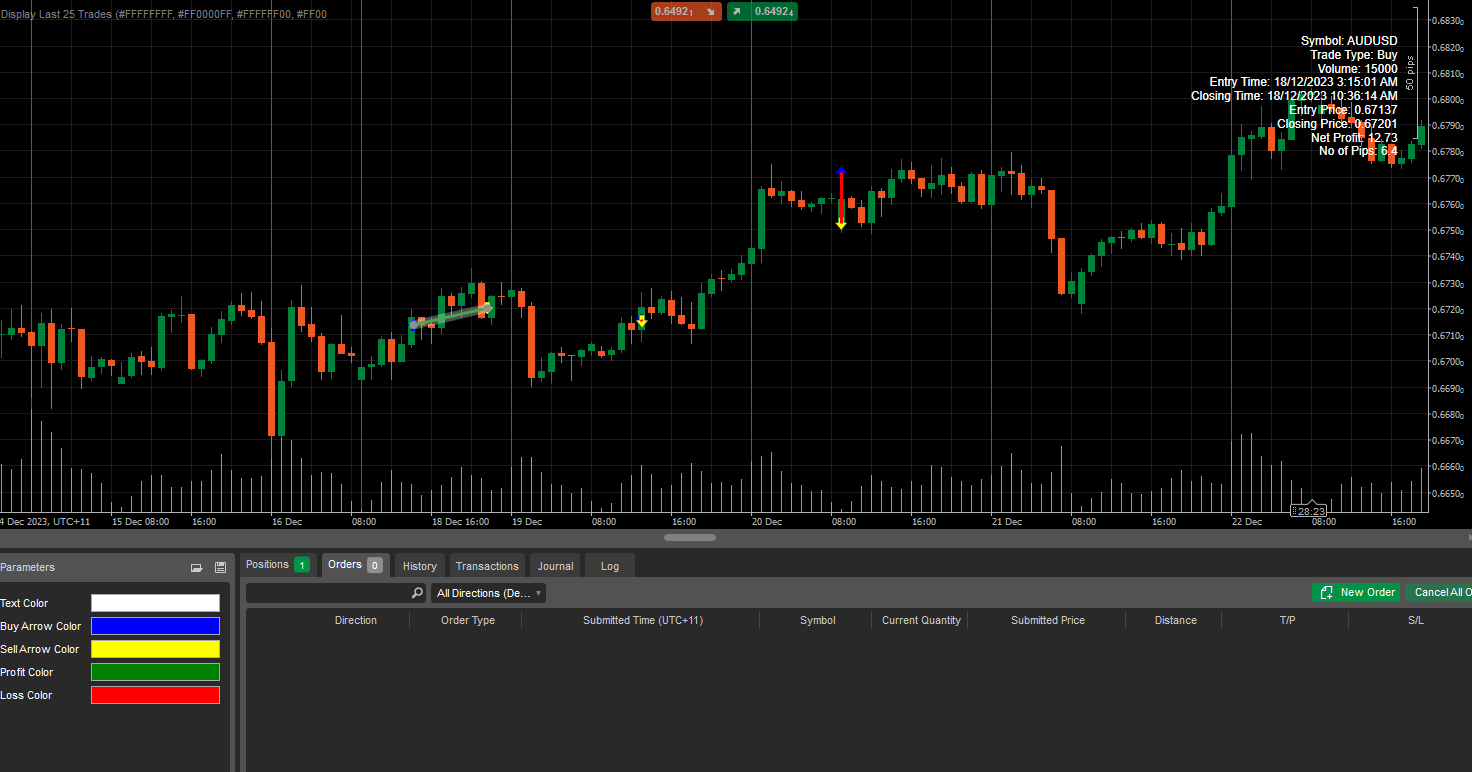
Does what it says on the box. A handy little tool for visualizing and analyzing the last 25 trades for the chart symbol.
get the Indicator here -----→ https://ancoles.gumroad.com/l/uperu
Plots buy and sell arrows on the chart area depending on the trade direction at the entry and exit time.
Draws a line between Entry Price and Closing Price which is defaulted to Green for profit or Red for loss.
Hovering over the line gives trade info of Symbol, Trade Direction, Volume, Entry and Exit Time, Entry and Exit Price, Net Profit and Trade Pips.
Colors are customizable in the Parameters box if you're not happy with the color scheme.
Choose your time frame carefully. Multiple 5 min trades on a 1 day chart is going to look a little messy.
The author decided to hide the source code.
Ancoles
Joined on 29.10.2023
- Distribution: Paid
- Language: C#
- Trading platform: cTrader Automate
- File name: Display Last 25 Trades.algo
- Rating: 0
- Installs: 0
- Modified: 24/04/2024 00:33
