Description
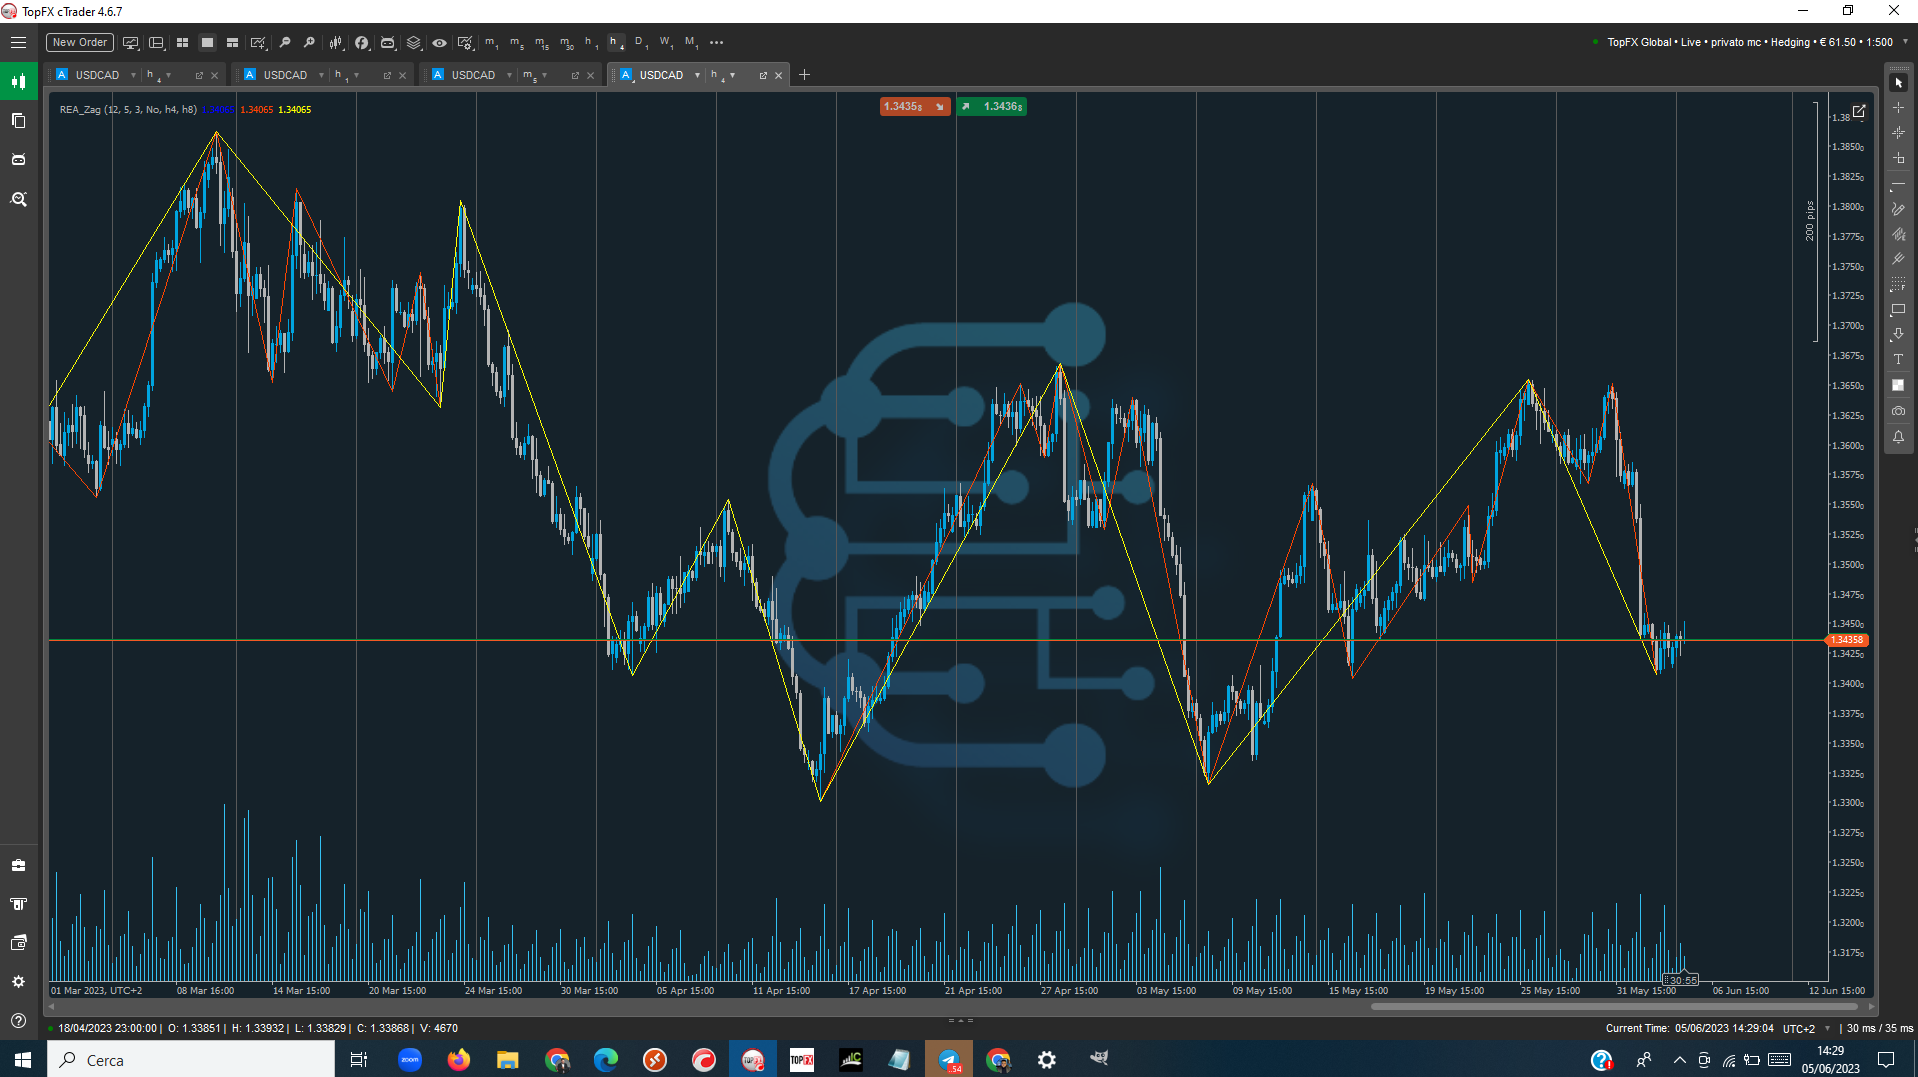
THIS ZIG ZAG IS MULTI-TIMEFRAME
View all our tool in our website: https://www.reavolution.com/en/category/strumenti/
The Zig Zag indicator reduces the impact of random price fluctuations and is used to identify price trends and changes in price trends. It lowers noise levels, highlighting the underlying trends lower and lower and works better in high-trend markets.
The Zig Zag indicator plots points on a chart each time prices reverse by more than a chosen variable. Straight lines are then drawn, connecting these points. ZIG ZAG is used to help identify price trends. It eliminates random price fluctuations and tries to show trend changes.
The so-called lines appear only when there is a price movement between a maximum of swing a minimum of swing greater than a specified percentage, often 5%. By filtering out minor price movements, the indicator makes trends easier to spot in all time intervals. Although the Zig Zag indicator does not predict future trends, it helps to identify potential support and resistance zones between tracked oscillation maxima and oscillation minima.
The indicator can also reveal reversal patterns, namely double bottoms and tops for head and shoulders. Traders can use popular technical indicators such as the relative strength index (RSI) and the stochastic oscillator to confirm whether the price of a stock is overbought or oversold when the Zig Zag line changes direction.
Our indicator inserts in the chart up to 3 Zig Zag. one of the current timeframe of the Graph and the other two from the timeframes selectable in the parameters.
Parameters
- Deth: Select Zigzag Periods
- Deviation: Select deviation in number of Candles
- BackStep: Fixed value at 3
- ShowHistory: Enable or Disable with Yes or No the visaulizzazione of the past movements of each Zig Zag
- Timeframe 1: Select the first timeframe other than the one in the chart.
- Timeframe 2: Select the second timeframe other than the one in the chart.
Lines
- Select the color for each Zig Zag Line
The author decided to hide the source code.
REAVOLUTION
Joined on 18.11.2022
- Distribution: Free
- Language: C#
- Trading platform: cTrader Automate
- File name: REA_Zag.algo
- Rating: 0
- Installs: 660
- Modified: 15/04/2024 14:09
