Warning! This section will be deprecated on February 1st 2025. Please move all your Indicators to the cTrader Store catalogue.
An update for this algorithm is currently pending moderation. Please revisit this page shortly to access the algorithm's latest version.
Description
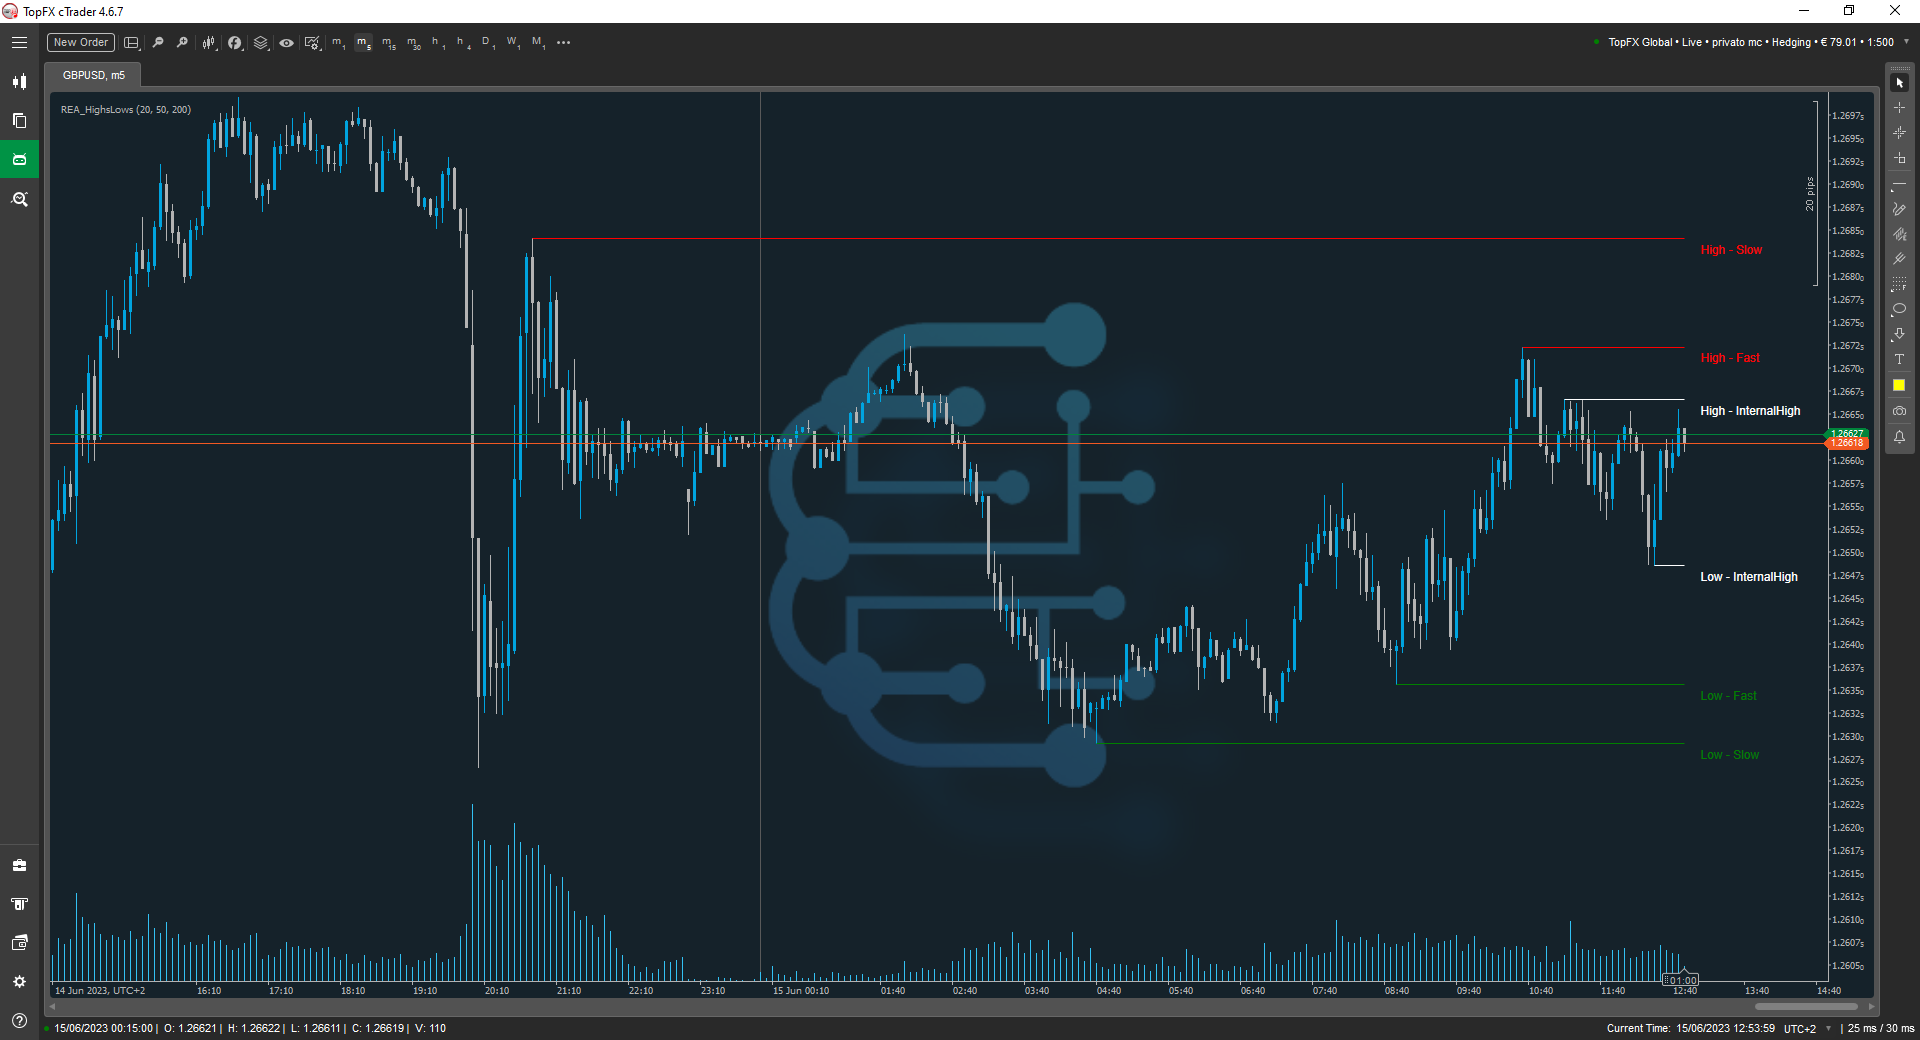
The REA_High&Low indicator allows you to graph the maxima and minima of different Structures, Internal , Fast and Slow.
View all our tool in our website: https://www.reavolution.com/en/category/strumenti/
Functionality
- Colored lines of the Maxima and Minimums not violated with Relative written of of of the belonging structure.
Parameters
CountBack
- Internal Structure: Enter the number of candles that must count back the indicator to draw the lines of the Internal Structure (the lower the Timeframe and the higher the value must be to detect the right zones)
- Fast Period: Enter the number of candles that must count back the indicator to draw the Quick Frame lines, the value must be higher than the internal structure but lower than the Slow Period (the lower the Timeframe, the higher the value to detect the right zones)
- Slow Period: Enter the number of candles that must count back the indicator to draw the lines of the Slow Structure, the value must be higher than the internal structure but lower than the Slow Period (the lower the Timeframe, the higher the value to detect the right zones)
The author decided to hide the source code.
REAVOLUTION
Joined on 18.11.2022
- Distribution: Free
- Language: C#
- Trading platform: cTrader Automate
- File name: REA_HighsLows.algo
- Rating: 0
- Installs: 597
- Modified: 15/04/2024 13:50

Note that publishing copyrighted material is strictly prohibited. If you believe there is copyrighted material in this section, please use the Copyright Infringement Notification form to submit a claim.
Comments
Log in to add a comment.
No comments found.