Description
THIS STOCHASTIC IS MULTI-TIMFRAME
View all our tool in our website: https://www.reavolution.com/en/category/strumenti/
The Stocastico is a tool of analysis of the momentum of a graph based on the relationship between minimum/ maximum current and minimum/ maximum average of the analyzed period.
Through the analysis of the momentum, this tool allows not only to identify the directionality of a trend, but also its strength, in addition to the exact moment in which its thrust will fail and, therefore, when the trend reversal becomes a correct and rational hypothesis. The indicator is graphically composed makes two lines (%K and %D) that oscillate within values from 0-100, generating operational signals intersecting.
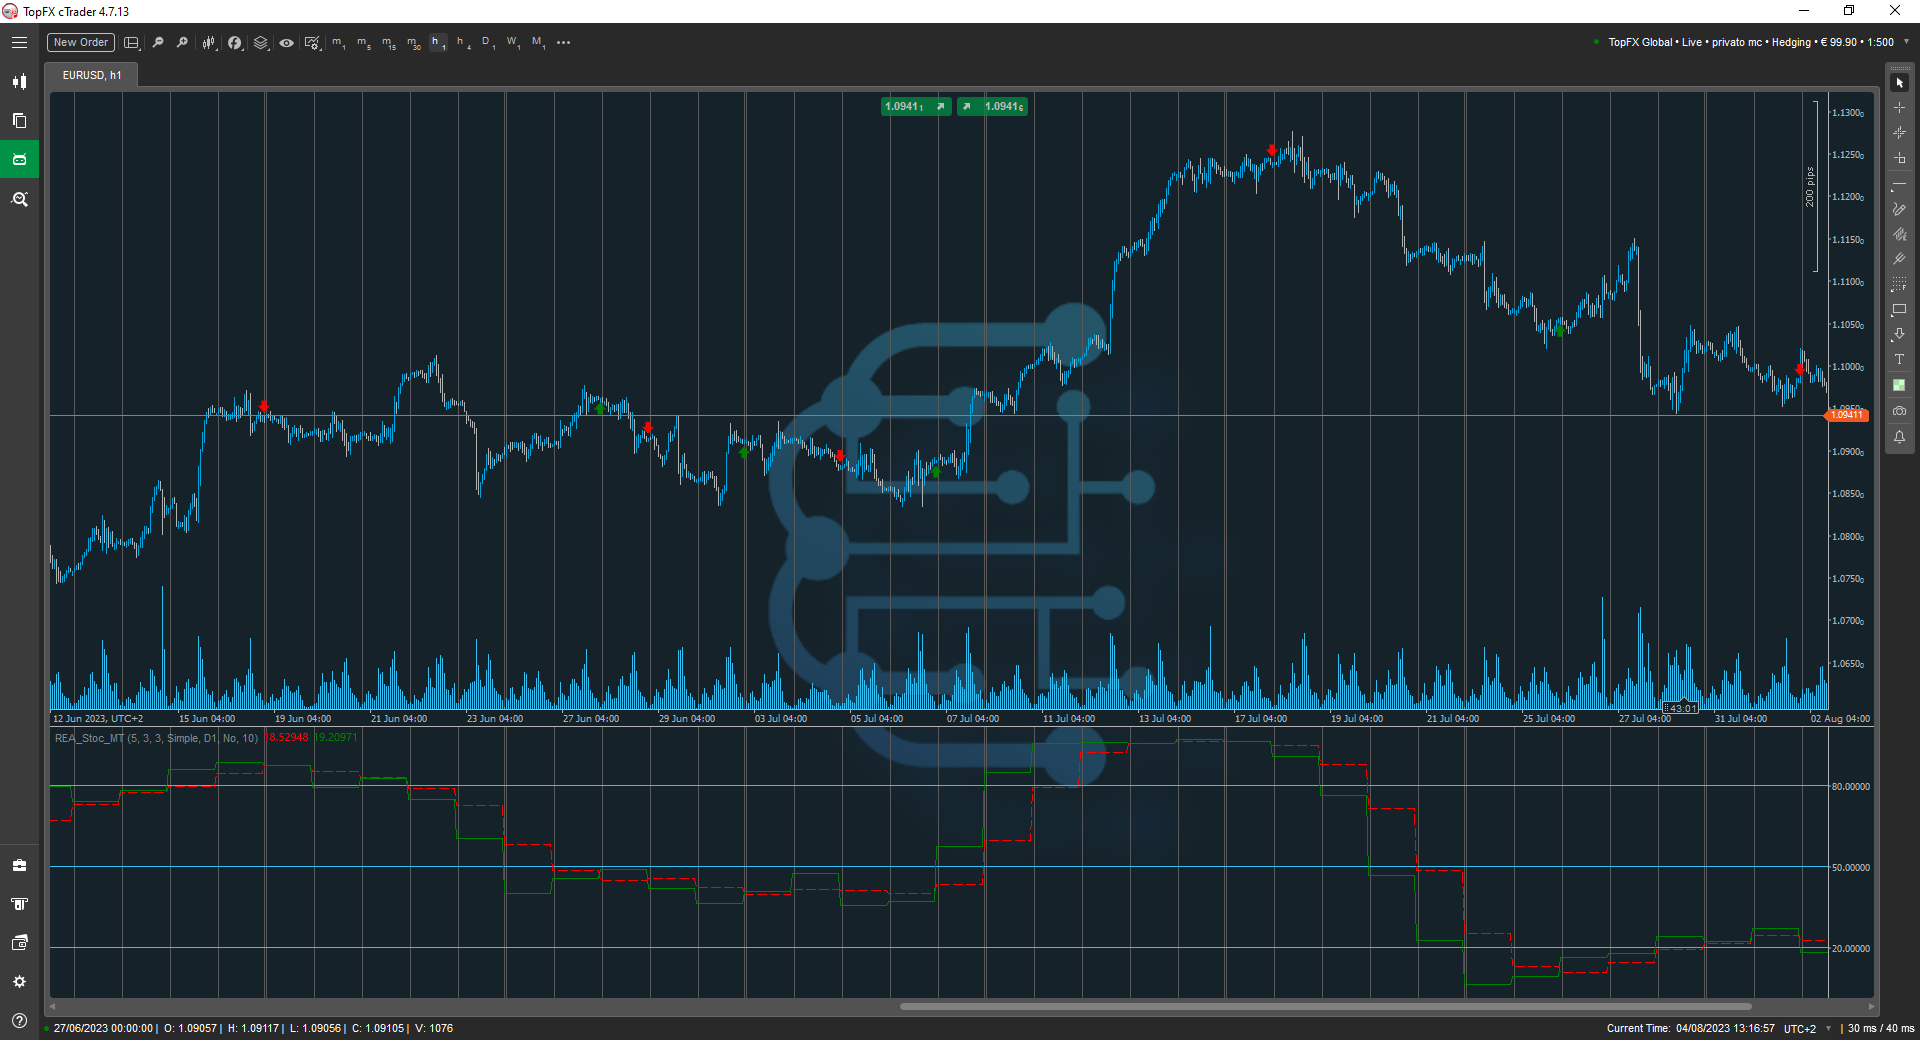
The line %K, of color Green in the diagram, is called also Fast Line and is given by the distance percentage of the closing price regarding the maximum or average minimum of the period. The line %D, red, is also called Slow Line and is the 3-period moving average of the Fast Line.
The Green line is, by nature, more responsive to price changes and volatility. The red line, on the other hand, has a slower and smoother trend but generates more reliable signals, eliminating the market noise from the oscillator, thus avoiding volatility peaks and inflationary spikes.
Our Stocastico has the particularity of having the Multi Timeframe works. That is, if you are viewing a Time Frame Chart you will be able to view in the oscillator, for example, the result of the D1 timeframe.
Another peculiarity are the arrows that we draw in the graph, at the moment of the I crown between the 2 lines of the stochastic.
Functionality
- Multi Timeframe Indicator
- Colored arrows.
Parameters
- %K Periods: Choose the number of periods of line %K (green line)
- %K Slowing: Choose the number of periods of %K Slowing.
- %D Periods: Choose number of periods of line %D (red line)
- MA Type: Choose the type of Moving Average on which the indicator has to perform the calculations.
- Timeframe: Select the Timeframe on which you want to display the oscillator.
- Smooting: Select Yes if you want the oscillator line to be rounded, or No if you want to leave the display at each bar.
- Arrow Distance: Selects the distance in pips from candles, for the drawn arrows.
The author decided to hide the source code.
REAVOLUTION
Joined on 18.11.2022
- Distribution: Free
- Language: C#
- Trading platform: cTrader Automate
- File name: REA_Stoc_MT.algo
- Rating: 0
- Installs: 414
- Modified: 15/04/2024 13:26
