Warning! This section will be deprecated on February 1st 2025. Please move all your Indicators to the cTrader Store catalogue.
An update for this algorithm is currently pending moderation. Please revisit this page shortly to access the algorithm's latest version.
Description
Candle Power Comparison Indicator
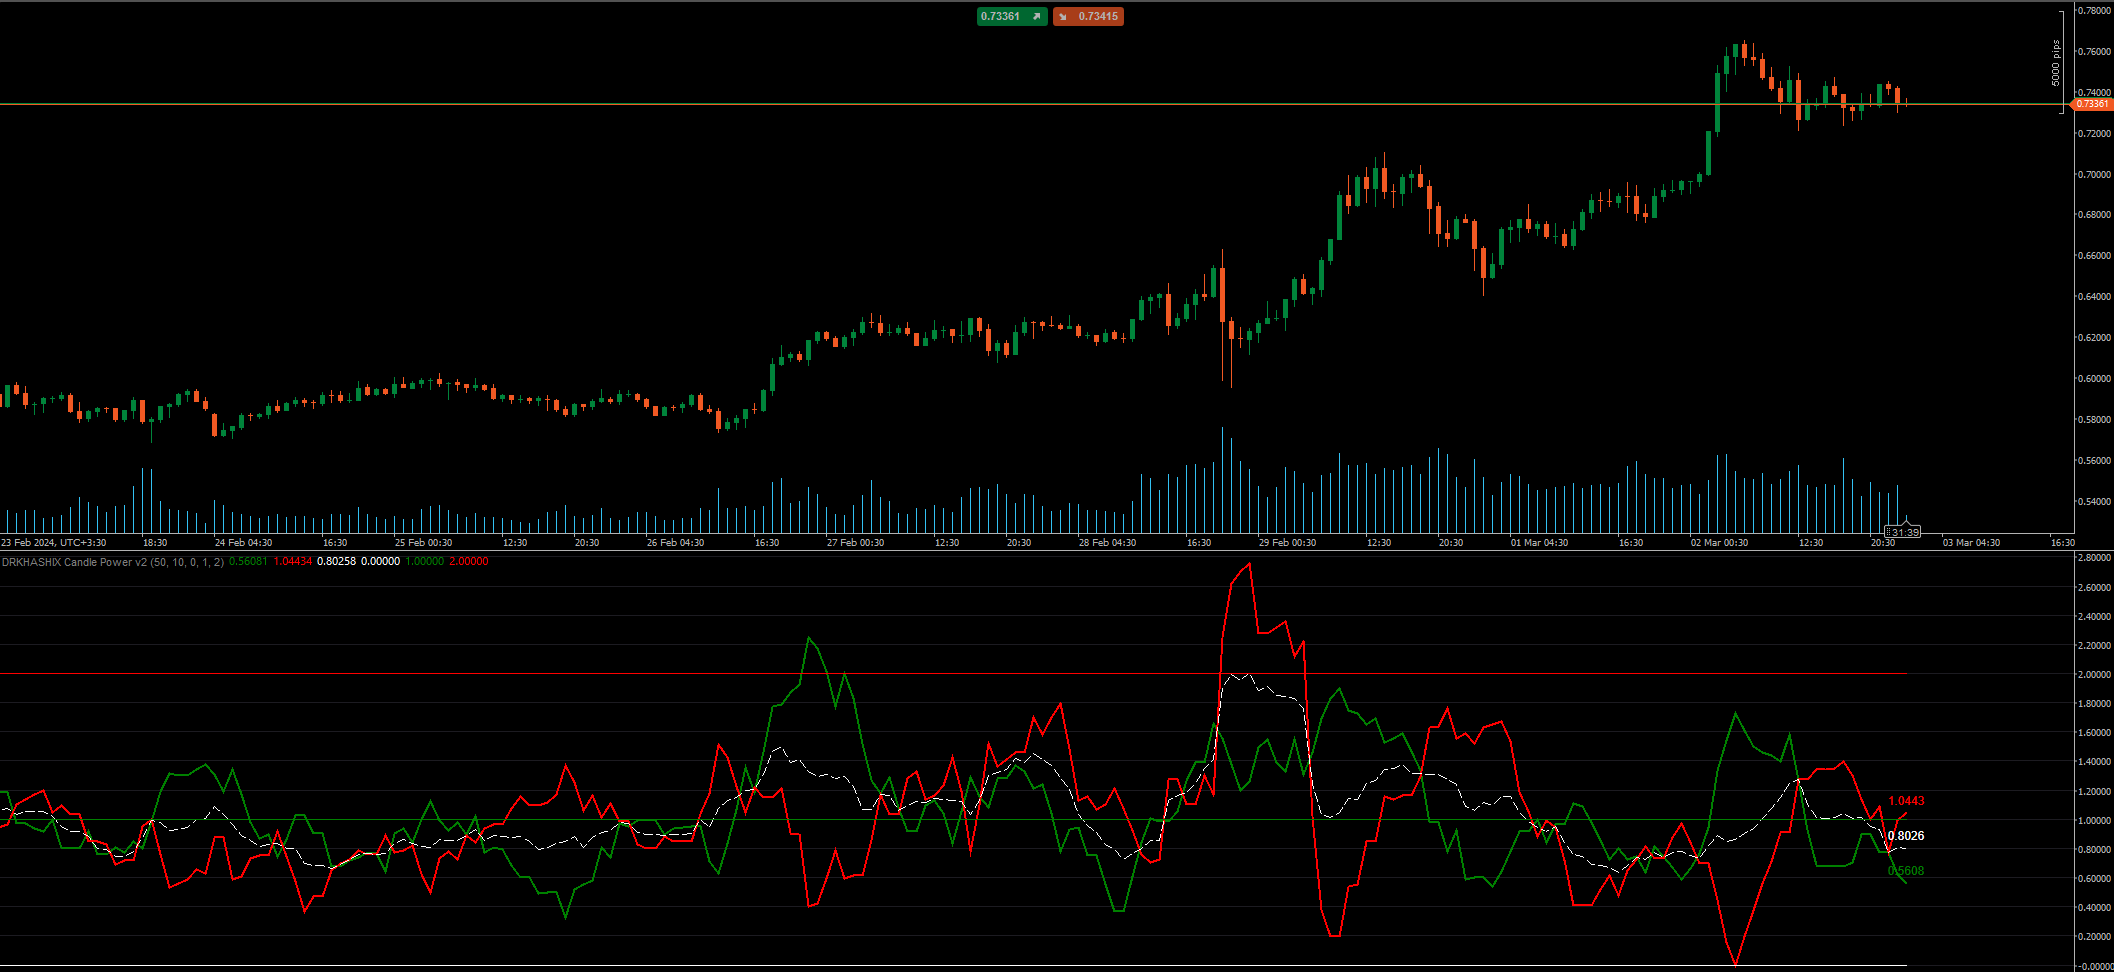
This indicator allows you to compare the power of bullish and bearish candles over time. You can use this indicator to analyze market trends and specifically observe relative increases or decreases in the strength of green or red candles.
Parameters:
- Period Reference: The number of candles used as a reference for calculating candle power.
- Period To Check: The number of candles to be examined to calculate candle power.
Outputs:
- Bullish Power: Indicates the relative strength of green candles.
- Bearish Power: Indicates the relative strength of red candles.
- Average Power: Represents the average power of green and red candles.
- Static Line 1: The desired static line 1.
- Static Line 2: The desired static line 2.
- Static Line 3: The desired static line 3.
Description:
- The power of green and red candles is displayed on the chart with colored lines.
- The average power of candles is represented by a white line.
- Static lines can be used to display constant values on the chart.
Note:
- You can use the output values to visualize the power of green and red candles on the chart.
The author decided to hide the source code.
drkhashix
Joined on 12.02.2023
- Distribution: Free
- Language: C#
- Trading platform: cTrader Automate
- File name: drkhashix Candle Power Comparison.algo
- Rating: 0
- Installs: 455
- Modified: 02/03/2024 21:34

Note that publishing copyrighted material is strictly prohibited. If you believe there is copyrighted material in this section, please use the Copyright Infringement Notification form to submit a claim.
Comments
Log in to add a comment.
No comments found.