Description
"To download the extraordinary Dr. khashix, please visit the drkhashix.com."
"Vittaverse is the best broker for bot and traid; they support a variety of currencies, have low spreads, and most importantly, provide you with funding."
this is link: click here for sign up Vittaverse
Description:
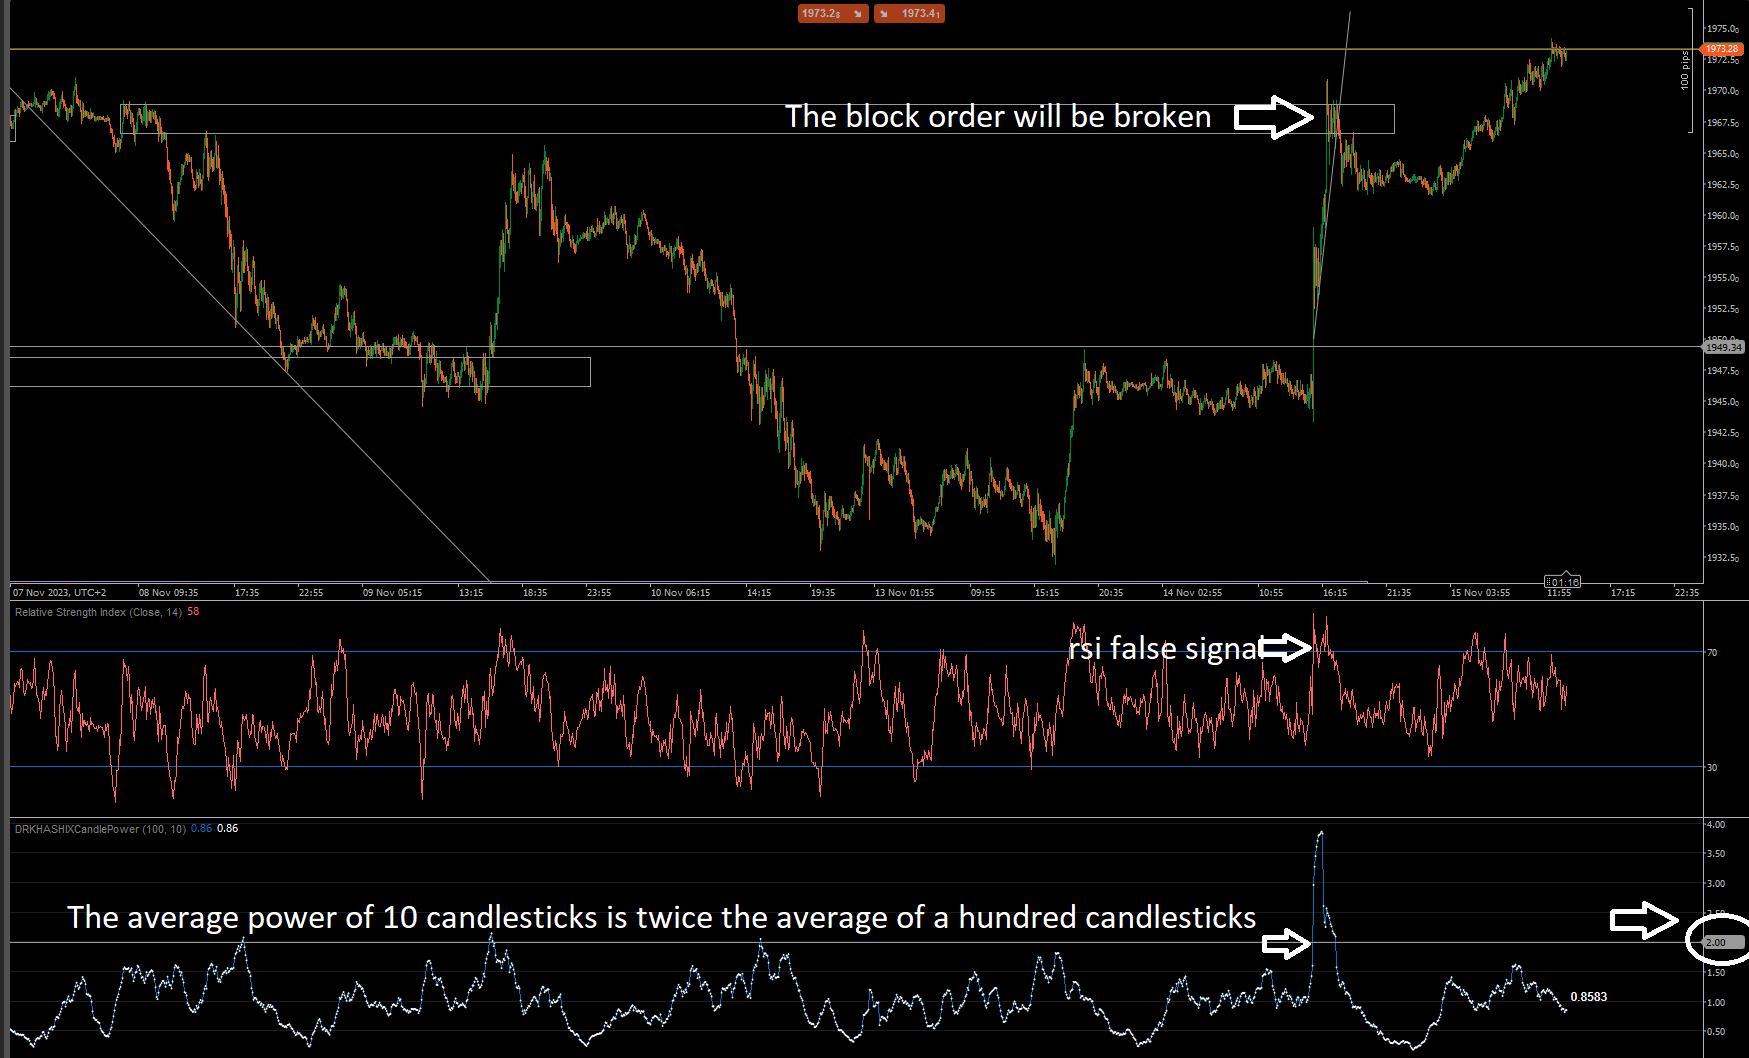
The DR.KHASHIX CandlePower Indicator, now in Version 2, introduces enhanced capabilities for a more nuanced market analysis. In this version, the indicator calculates the average height of the latest 10 candles and compares it to the average height of the last 100 candles. This comparison provides valuable insights into the current candle's strength relative to a longer-term candle height average.
How to Use:
Candle Power:
The indicator's value at each chart point reflects the strength of the current candle. Higher values denote more robust candles, while lower values indicate candles with less strength.
Label:
Displayed as decimal numbers, the Label provides a precise measurement for analysis, offering additional insights into candle strength.
Applications:
Order Block Breaks:
The CandlePower Indicator remains a valuable tool for predicting order block breaks, now with enhanced sensitivity due to the refined calculation based on the average height of recent candles.
Algorithmic Trading:
Incorporate Version 2 of this indicator into algorithmic trading strategies for improved decision-making, especially when considering the short-term versus long-term candle strength dynamics.
"To download the extraordinary Dr. khashix, please visit the drkhashix.com."

Note:
For default settings, the indicator now compares the average height of the latest 10 candles to the average height of the last 100 candles. It is still advisable to use this indicator alongside other technical tools for a comprehensive market analysis. Your experience and market analysis skills play a crucial role in leveraging the full potential of this enhanced version.
Best regards,
Dr. Khashix.
The author decided to hide the source code.
drkhashix
Joined on 12.02.2023
- Distribution: Free
- Language: C#
- Trading platform: cTrader Automate
- File name: DRKHASHIXCandlePowerv2.algo
- Rating: 5
- Installs: 709
- Modified: 15/11/2023 13:15

Comments
Let dif Hilo body and fractal down on the indicator, hide the other.
What is a good trend: full candles that follow their path without a reverse rejection.
The indicator I shared with you analyzes the difference between full candles and rejection candles.
Therefore, the output 'dif hilo body' indicates when it follows an upward angle, a strong trend without rejection, and conversely, during a downward angle, the rejection zones become more significant, so the trend decreases.
The fractal Down line shows when the diff Milo line reaches its new minimum, indicating a possible trend reversal or a consolidation zone in view of the trend's continuity.
Have a great day!
Oh man, this is very complicated. Please explain a little more about the added lines and its usage
RE : Here is a version 2, which allows you to see when the trend ends. There are many possibilities here, such as adding a moving average, Bollinger bands, etc. Worth checking out!
using System;
using cAlgo.API;
using cAlgo.API.Internals;
namespace cAlgo
{
[Indicator(IsOverlay = false, AccessRights = AccessRights.None)]
public class DRKHASHIXCandlePower : Indicator
{
[Parameter("Period Reference", DefaultValue = 100, MinValue = 1, Group = "PeriodReference")]
public int PeriodReference { get; set; }
[Parameter("Period To Check", DefaultValue = 10, MinValue = 1, Group = "PeriodReference")]
public int PeriodToCheck { get; set; }
[Parameter("Fractal Period", DefaultValue = 10, MinValue = 1, Group = "End Trend")]
public int FractalDown { get; set; }
[Parameter("Fractal Shift", DefaultValue = 10, MinValue = 1, Group = "End Trend")]
public int FractalShift { get; set; }
[Output("Candle Power Hilo", LineColor = "DeepSkyBlue")]
public IndicatorDataSeries CandlePowerHilo { get; set; }
[Output("Candle Power Body", LineColor = "Orange")]
public IndicatorDataSeries CandlePowerBody { get; set; }
[Output("LabelHilo", Color = Colors.White, PlotType = PlotType.Points, Thickness = 1)]
public IndicatorDataSeries LabelHilo { get; set; }
[Output("LabelBody", Color = Colors.White, PlotType = PlotType.Points, Thickness = 1)]
public IndicatorDataSeries LabelBody { get; set; }
[Output("Diff Hilo Body", LineColor = "Lime")]
public IndicatorDataSeries DiffHiloBody { get; set; }
[Output("Fractal Down", LineColor = "Red")]
public IndicatorDataSeries Fractal { get; set; }
private IndicatorDataSeries res, min;
protected override void Initialize()
{
res = CreateDataSeries();
min = CreateDataSeries();
}
public override void Calculate(int index)
{
if (index < Math.Max(PeriodReference, PeriodToCheck))
return;
double sumCandleHeightReference = 0;
double sumCandleHeightToCheckHiLo = 0;
double sumCandleHeightToCheckBody = 0;
for (int i = 0; i < PeriodReference; i++)
sumCandleHeightReference += MarketSeries.High[index - i] - MarketSeries.Low[index - i];
for (int i = 0; i < PeriodToCheck; i++)
sumCandleHeightToCheckHiLo += MarketSeries.High[index - i] - MarketSeries.Low[index - i];
for (int i = 0; i < PeriodToCheck; i++)
sumCandleHeightToCheckBody += Math.Max(MarketSeries.Open[index - i], MarketSeries.Close[index - i]) - Math.Min(MarketSeries.Open[index - i], MarketSeries.Close[index - i]);
double averageCandleHeightReference = sumCandleHeightReference / PeriodReference;
double averageCandleHeightToCheckHilo = sumCandleHeightToCheckHiLo / PeriodToCheck;
double averageCandleHeightToCheckBody = sumCandleHeightToCheckBody / PeriodToCheck;
double candlePowerHilo = averageCandleHeightToCheckHilo / averageCandleHeightReference;
double candlePowerBody = averageCandleHeightToCheckBody / averageCandleHeightReference;
CandlePowerHilo[index] = candlePowerHilo;
CandlePowerBody[index] = candlePowerBody;
LabelHilo[index] = candlePowerHilo;
LabelBody[index] = candlePowerBody;
ChartObjects.DrawText("LabelHilo", candlePowerHilo.ToString("F4"), index, CandlePowerHilo[index], VerticalAlignment.Top, HorizontalAlignment.Right, Colors.White);
ChartObjects.DrawText("LabelBody", candlePowerBody.ToString("F4"), index, CandlePowerBody[index], VerticalAlignment.Bottom, HorizontalAlignment.Right, Colors.White);
res[index] = CandlePowerHilo[index] - CandlePowerBody[index];
DiffHiloBody[index] = res[index];
Fractal[index + FractalShift] = DiffHiloBody.Minimum(FractalDown);
}
}
}
Hi, littl add here :
using System;
using cAlgo.API;
using cAlgo.API.Internals;
namespace cAlgo
{
[Indicator(IsOverlay = false, AccessRights = AccessRights.None)]
public class DRKHASHIXCandlePower : Indicator
{
[Parameter("Period Reference", DefaultValue = 100, MinValue = 1)]
public int PeriodReference { get; set; }
[Parameter("Period To Check", DefaultValue = 10, MinValue = 1)]
public int PeriodToCheck { get; set; }
[Output("Candle Power Hilo", LineColor = "FF0070C0")]
public IndicatorDataSeries CandlePowerHilo { get; set; }
[Output("Candle Power Body", LineColor = "FF0070C0")]
public IndicatorDataSeries CandlePowerBody { get; set; }
[Output("LabelHilo", Color = Colors.White, PlotType = PlotType.Points, Thickness = 1)]
public IndicatorDataSeries LabelHilo { get; set; }
[Output("LabelBody", Color = Colors.White, PlotType = PlotType.Points, Thickness = 1)]
public IndicatorDataSeries LabelBody { get; set; }
protected override void Initialize()
{
// Initialize anything here if needed
}
public override void Calculate(int index)
{
if (index < Math.Max(PeriodReference, PeriodToCheck))
return;
double sumCandleHeightReference = 0;
double sumCandleHeightToCheckHiLo = 0;
double sumCandleHeightToCheckBody = 0;
for (int i = 0; i < PeriodReference; i++)
sumCandleHeightReference += MarketSeries.High[index - i] - MarketSeries.Low[index - i];
for (int i = 0; i < PeriodToCheck; i++)
sumCandleHeightToCheckHiLo += MarketSeries.High[index - i] - MarketSeries.Low[index - i];
for (int i = 0; i < PeriodToCheck; i++)
sumCandleHeightToCheckBody += Math.Max(MarketSeries.Open[index - i], MarketSeries.Close[index - i]) - Math.Min(MarketSeries.Open[index - i], MarketSeries.Close[index - i]);
double averageCandleHeightReference = sumCandleHeightReference / PeriodReference;
double averageCandleHeightToCheckHilo = sumCandleHeightToCheckHiLo / PeriodToCheck;
double averageCandleHeightToCheckBody = sumCandleHeightToCheckBody / PeriodToCheck;
double candlePowerHilo = averageCandleHeightToCheckHilo / averageCandleHeightReference;
double candlePowerBody = averageCandleHeightToCheckBody / averageCandleHeightReference;
CandlePowerHilo[index] = candlePowerHilo;
CandlePowerBody[index] = candlePowerBody;
LabelHilo[index] = candlePowerHilo;
LabelBody[index] = candlePowerBody;
ChartObjects.DrawText("LabelHilo", candlePowerHilo.ToString("F4"), index, CandlePowerHilo[index], VerticalAlignment.Top, HorizontalAlignment.Right, Colors.White);
ChartObjects.DrawText("LabelBody", candlePowerBody.ToString("F4"), index, CandlePowerBody[index], VerticalAlignment.Bottom, HorizontalAlignment.Right, Colors.White);
}
}
}
Or you can use it, he work good too :
using System;
using System.Collections.Generic;
using System.Linq;
using System.Text;
using cAlgo.API;
using cAlgo.API.Collections;
using cAlgo.API.Indicators;
using cAlgo.API.Internals;
namespace cAlgo
{
[Indicator(IsOverlay = false, AccessRights = AccessRights.None)]
public class VhfFractalDown : Indicator
{
[Parameter("Vhf Period", DefaultValue = 15, MinValue = 1, Group = "Vertical/Horizontal Filter")]
public int Period { get; set; }
[Parameter("Fractal Period", DefaultValue = 10, MinValue = 1, Group = "Signal")]
public int PeriodFractal { get; set; }
[Parameter("Fractal Shift", DefaultValue = 1, MinValue = 1, Group = "Signal")]
public int FractalShift { get; set; }
[Output("Vhf", LineColor = "DeepSkyBlue")]
public IndicatorDataSeries Vhf { get; set; }
[Output("FractalDown", LineColor = "Orange")]
public IndicatorDataSeries FractalDown { get; set; }
private IndicatorDataSeries min;
private VerticalHorizontalFilter vhf;
protected override void Initialize()
{
min = CreateDataSeries();
vhf = Indicators.VerticalHorizontalFilter(Bars.ClosePrices, Period);
}
public override void Calculate(int index)
{
Vhf[index] = vhf.Result.Last(0);
FractalDown[index + FractalShift] = vhf.Result.Minimum(PeriodFractal);
}
}
}