Description
Similar with VWAP, but instead of reset at an anchor point, the calculation is kept rolling, in a similar way that moving average is calculated.
I found it is somewhat interesting, it looks similar to Bollinger Band, but there is differences. The main line is the VWAP instead of ma. So I put it in Trend, although you can spot Volarity.
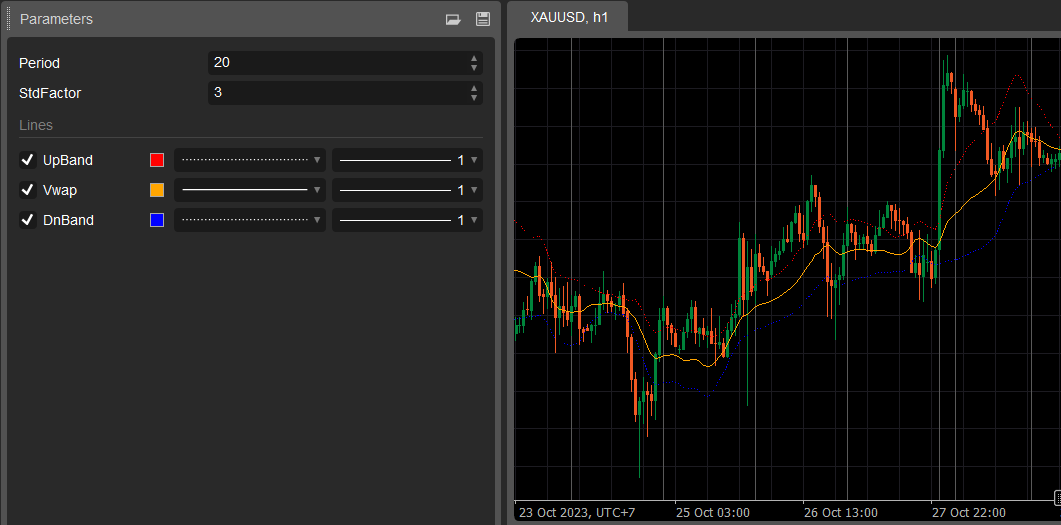
You can spot some squeeze period before a boost. Please share your usage!
Note that there is a difference in the way I calculated std versus the Bollinger Band:
- Bollinger Band: the deviation of each xi = (xi - mean at latest) . They assumes a straight line from the latest mean.
- This approach: the deviation of each xi = (xi - mean i).
This result in a smoother in the band.
Parameters:
- Period: the number of bars used for calculation.
- StdFactor: factor used for calculating the bands.
PS: For enquiries please drop me an email. (I answered a comment on this platform and got blocked by accident, may be by their auto bot).
The source code is almost fully published.
using System;
using System.Collections.Generic;
using System.Linq;
using System.Text;
using cAlgo.API;
using cAlgo.API.Collections;
using cAlgo.API.Indicators;
using cAlgo.API.Internals;
using LittleTrader.Extensions;

namespace cAlgo
{
    [Indicator(IsOverlay = true, AutoRescale = true, AccessRights = AccessRights.None)]
    public class LT_Ind_RollingVWAP : Indicator
    {
        [Parameter(DefaultValue = 20)]
        public int Period { get; set; }

        [Parameter(DefaultValue = 3.0)]
        public double StdFactor { get; set; }


        [Output("UpBand", LineColor = "Red", LineStyle = LineStyle.Dots)]
        public IndicatorDataSeries UpBand { get; set; }
        [Output("Vwap", LineColor = "Orange")]
        public IndicatorDataSeries Vwap { get; set; }
        [Output("DnBand", LineColor = "Blue", LineStyle = LineStyle.Dots)]
        public IndicatorDataSeries DnBand { get; set; }

        IndicatorDataSeries _sqrDiff;
        protected override void Initialize()
        {
            _sqrDiff = CreateDataSeries();
        }

        public override void Calculate(int index)
        {
            // The vwap at index
            var list = Bars.Rev(index).Take(Period).ToList();
            if (list.Count <= 0 || list.Last().TickVolume == 0) return;
            var vwap = list.Sum(x => x.TickVolume * (x.High + x.Low + x.Close) / 3) / list.Sum(x => x.TickVolume);
            Vwap[index] = vwap;

            // Square diff at index (Use close instead of hlc3 for more variation)
            _sqrDiff[index] = (Bars.ClosePrices[index] - vwap).MathPow(2);

            // Std at index
            var sqdList = _sqrDiff.Rev(index).Take(Period).ToList();
            var std = sqdList.Sum().MathSqrt() / sqdList.Count;
            UpBand[index] = vwap + StdFactor * std;
            DnBand[index] = vwap - StdFactor * std;
        }

    }

}
dhnhuy
Joined on 03.04.2023
- Distribution: Free
- Language: C#
- Trading platform: cTrader Automate
- File name: LT_Ind_RollingVWAP.algo
- Rating: 0
- Installs: 890
- Modified: 08/11/2023 04:11

this is an interesting approach. i've been kinda sidetracked of late looking at ICT concepts and therefore have been ignoring traditional TA. However, I have always found VWAP to be quite attractive representation of price action and using it in this way may definitely allow one to SEE those narrow bands of indecision prior to price change.
will definitely look into this…