Description
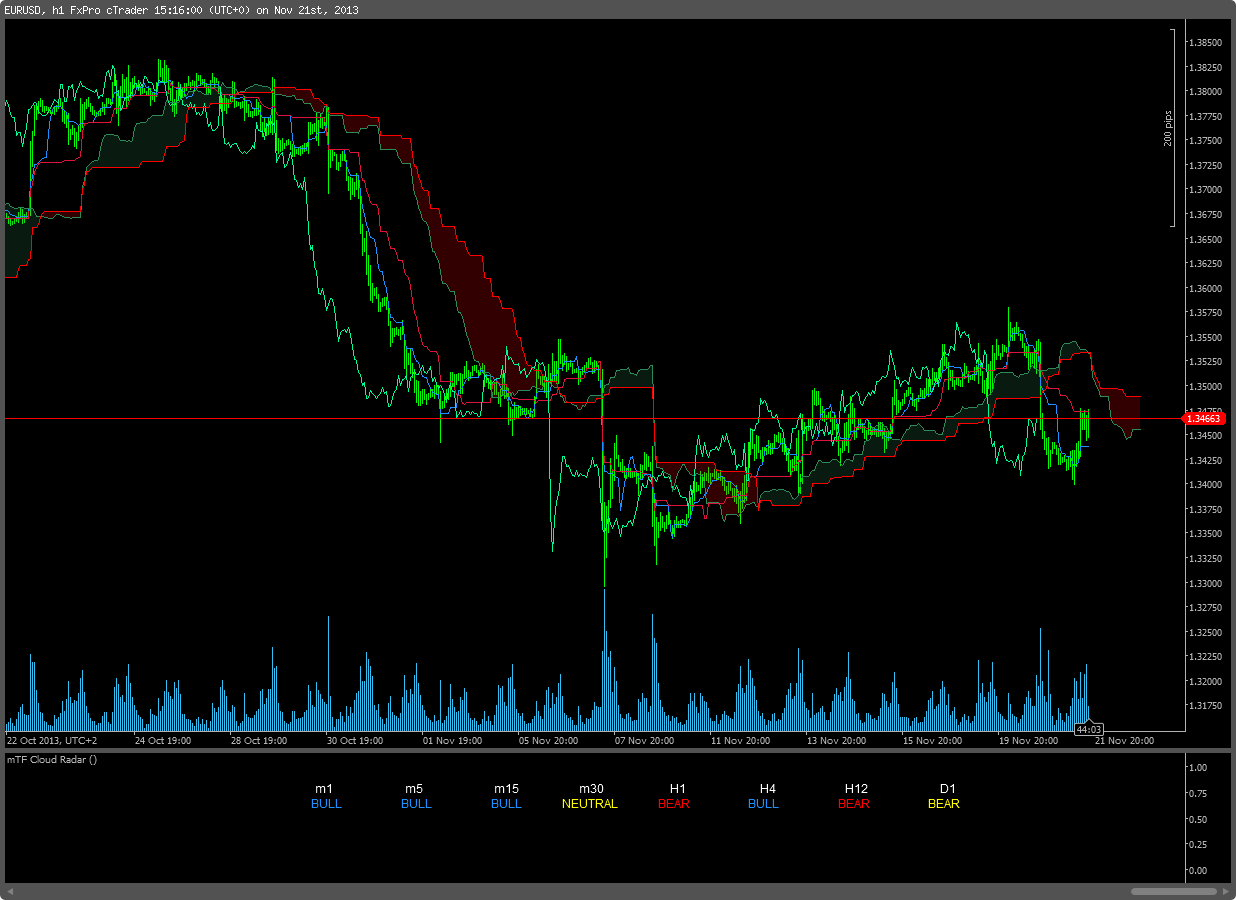
This is an indicator that uses the Ichimolu Kinko Hyo indicator and it reports if the price is in the bullish/bearish/neutral territory (price above, bellow or inside the cloud) for various timeframes.

u
gedet
Joined on 20.08.2013
- Distribution: Free
- Language: C#
- Trading platform: cTrader Automate
- File name: mTF Ichimoku Radar.algo
- Rating: 0
- Installs: 6012
- Modified: 13/10/2021 09:54
Comments
Hi,
how I can insert weekly and montly time frame ?
Please Help, How do you fill the color between 2 line?
Can somebody please update this to work with the current version. Using his copy, I cannot see anything. Trying to compile his copy brings up an error, and copy the code to compile my own copy show nothing on screen either.
Help would be greatly appreciated :)
@wifirex this indicator does not actually display the Ichimoku components its rather based on the built in indicator in order to show the position of the price with respect to the kumo for various timeframes. If you need an indicator that shows the components of the ichimoku system (kijun, tenkan etc) then either try the built in ichimoku indicator, or download one from this site.
Hey Gedet, nice work!
How do I make the Ichi graph show on my chart? I can only get the "bull, neutral and bear" time-frame list to show, but I'd like to see the lines and the clouds instead.
Thanks!
I 've just uploaded "mTF Cloud Component Radar" and it displays the ichimoku components, hope this helps Larry.
If you change the value of IsOverlay to true it will display the indicator on the chart, that will save you some real estate...
using System;
using cAlgo.API;
using cAlgo.API.Internals;
using cAlgo.API.Indicators;
namespace cAlgo.Indicators
{
[Indicator(IsOverlay = false, TimeZone = TimeZones.UTC)]
....
As for the rest of the ichimoku components it needs a bit more coding, I will look into it.

Hello Gedet and thank you for this wonderful tool. I trade ichimoku on all forex charts and more than 100 pair every day (daily and 4H).
The perfect solution for me would be a tool that also shows:
1) Tenkansen is below or above and in line to kijunsen.
2) Chikou is below or above: 1) Kijunsen 2) Cloud 3) Price
Theese information placed along with tool here at 3 line levels would for me be the world's best tool.
That way, a very large workload would be released in my trading.
I wish you all good trading.
/Jorgen.