Description
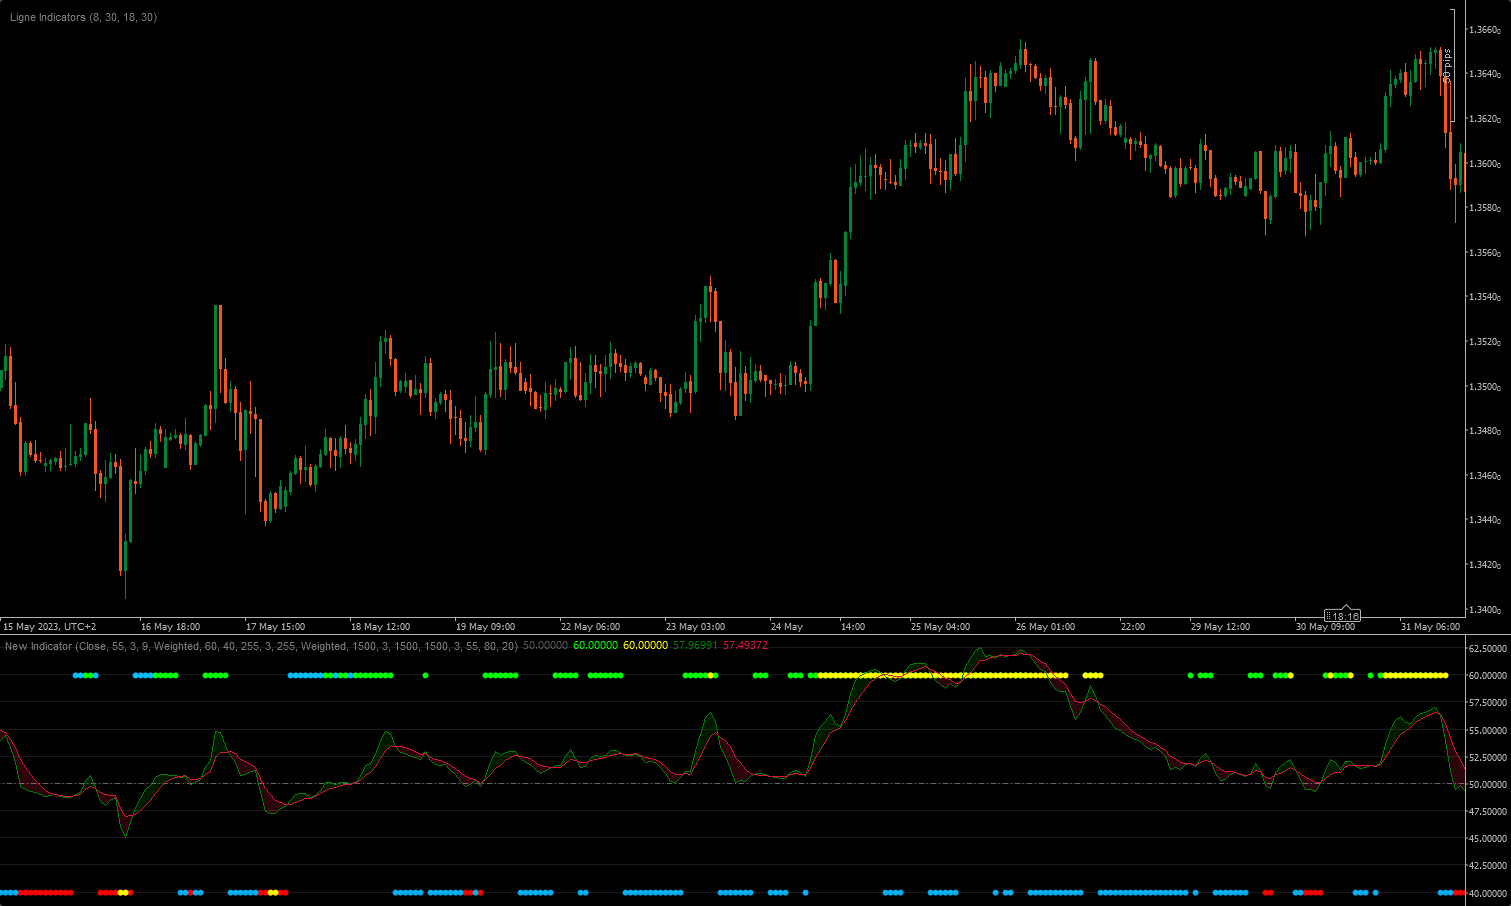
RSI Concept Combining 3 Stochastics:
High Line Color Code:
Yellow = The highest upward trend, and when it fades, a potential trend reversal might occur.
Green = High Upward Trend
Blue = Low Upward Trend
Down Line Color Code:
Yellow = The highest downward trend, and when it fades, a potential trend reversal might occur.
Red = High Downward Trend
Blue = Low Downward Trend
How the Indicator is Calculated:
Blue/Green/Red: This indicator takes into account the 3 stochastics to determine if they are above or below the signal line.
Yellow: A confirmation from the RSI cloud adds a yellow dot, signifying an Over (Buy/Sell) condition. This confirmation occurs when the yellow color disappears.
Test it before adopting it!
Have fun, and for any collaboration, contact me !!!
On telegram : https://t.me/nimi012 (direct messaging)
On Discord: https://discord.gg/jNg7BSCh (I advise you to come and see, Money management strategies and Signals Strategies !)

using System;
using System.Collections.Generic;
using System.Linq;
using System.Text;
using cAlgo.API;
using cAlgo.API.Collections;
using cAlgo.API.Indicators;
using cAlgo.API.Internals;

namespace cAlgo
{
    [Cloud("ResultSmoothFast", "ResultSmoothSlow")]
    [Indicator(AccessRights = AccessRights.None)]
    public class RsiStochSrategie : Indicator
    {
        [Parameter("Source Rsi", DefaultValue = "Close", MinValue = 1, Group = "Rsi")]
        public DataSeries SourceRsi { get; set; }
        [Parameter("Period Rsi", DefaultValue = 55, MinValue = 1, Group = "Rsi")]
        public int PeriodRsi { get; set; }
        [Parameter("Smooth Fast", DefaultValue = 3, MinValue = 1, Group = "Rsi")]
        public int SmoothFast { get; set; }
        [Parameter("Smooth Slow", DefaultValue = 9, MinValue = 1, Group = "Rsi")]
        public int SmoothSlow { get; set; }
        [Parameter("Ma K Slowing", DefaultValue = MovingAverageType.Weighted, Group = "5")]
        public MovingAverageType MaTypeSmooth { get; set; }

        [Parameter("Level Line High", DefaultValue = 60, MinValue = 1, Group = "Rsi")]
        public int LevelLineHigh { get; set; }
        [Parameter("Level Line Low", DefaultValue = 40, MinValue = 1, Group = "Rsi")]
        public int LevelLineLow { get; set; }

        [Parameter("K period", DefaultValue = 55, MinValue = 1, Group = "Stoch 1")]
        public int KPeriod { get; set; }
        [Parameter("K Slowing", DefaultValue = 3, MinValue = 1, Group = "Stoch 1")]
        public int KSlowingPeriod { get; set; }
        [Parameter("D Period", DefaultValue = 55, MinValue = 1, Group = "Stoch 1")]
        public int DPeriod { get; set; }
        [Parameter("Ma K Slowing", DefaultValue = MovingAverageType.Weighted, Group = "Stoch 1")]
        public MovingAverageType MaTypeKSlowing { get; set; }

        [Parameter("K period2", DefaultValue = 255, MinValue = 1, Group = "Stoch 2")]
        public int KPeriod2 { get; set; }
        [Parameter("K Slowing2", DefaultValue = 3, MinValue = 1, Group = "Stoch 2")]
        public int KSlowingPeriod2 { get; set; }
        [Parameter("D Period2", DefaultValue = 255, MinValue = 1, Group = "Stoch 2")]
        public int DPeriod2 { get; set; }

        [Parameter("K period3", DefaultValue = 1500, MinValue = 1, Group = "Stoch 3")]
        public int KPeriod3 { get; set; }
        [Parameter("K Slowing3", DefaultValue = 3, MinValue = 1, Group = "Stoch 3")]
        public int KSlowingPeriod3 { get; set; }
        [Parameter("D Period3", DefaultValue = 1500, MinValue = 1, Group = "Stoch 3")]
        public int DPeriod3 { get; set; }

        [Parameter("Over Buy Level", DefaultValue = 80, MinValue = 1, Group = "Stoch Level")]
        public int OverBuyLevel { get; set; }
        [Parameter("Over Sell Level", DefaultValue = 20, MinValue = 1, Group = "Stoch Level")]
        public int OverSellLevel { get; set; }

        [Output("Lvl Middle", PlotType = PlotType.Line, LineStyle = LineStyle.LinesDots, LineColor = "56FFFFFF", Thickness = 1)]
        public IndicatorDataSeries LvlMiddle { get; set; }

        [Output("High Trend Down ", PlotType = PlotType.Points, LineColor = "Red", Thickness = 5)]
        public IndicatorDataSeries HighTrendDown { get; set; }
        [Output("High Trend Up", PlotType = PlotType.Points, LineColor = "Lime", Thickness = 5)]
        public IndicatorDataSeries HighTrendUp { get; set; }

        [Output("Low Trend Up", PlotType = PlotType.Points, LineColor = "DeepSkyBlue", Thickness = 5)]
        public IndicatorDataSeries LowTrendUp { get; set; }
        [Output("Low Trend Down", PlotType = PlotType.Points, LineColor = "DeepSkyBlue", Thickness = 5)]
        public IndicatorDataSeries LowTrendDown { get; set; }

        [Output("OverBuy", PlotType = PlotType.Points, LineColor = "Yellow", Thickness = 5)]
        public IndicatorDataSeries OverBuy { get; set; }
        [Output("OverSell", PlotType = PlotType.Points, LineColor = "Yellow", Thickness = 5)]
        public IndicatorDataSeries OverSell { get; set; }

        [Output("ResultSmoothFast", PlotType = PlotType.Line, LineColor = "Green", Thickness = 1)]
        public IndicatorDataSeries ResultSmoothFast { get; set; }
        [Output("ResultSmoothSlow", PlotType = PlotType.Line, LineColor = "Crimson", Thickness = 1)]
        public IndicatorDataSeries ResultSmoothSlow { get; set; }

        private StochasticOscillator _stoch1, _stoch2, _stoch3;
        private RelativeStrengthIndex _rsi;
        private IndicatorDataSeries _rsiData;
        private MovingAverage _rsiSmoothSlow, _rsiSmoothFast;

        protected override void Initialize()
        {
            _stoch1 = Indicators.StochasticOscillator(KPeriod, KSlowingPeriod, DPeriod, MaTypeKSlowing);
            _stoch2 = Indicators.StochasticOscillator(KPeriod2, KSlowingPeriod2, DPeriod2, MaTypeKSlowing);
            _stoch3 = Indicators.StochasticOscillator(KPeriod3, KSlowingPeriod3, DPeriod3, MaTypeKSlowing);

            _rsiData = CreateDataSeries();
            _rsi = Indicators.RelativeStrengthIndex(SourceRsi, PeriodRsi);
            _rsiSmoothFast = Indicators.MovingAverage(_rsiData, SmoothFast, MaTypeSmooth);
            _rsiSmoothSlow = Indicators.MovingAverage(_rsiData, SmoothSlow, MaTypeSmooth);
        }

        public override void Calculate(int index)
        {

            _rsiData[index] = _rsi.Result.Last(0);

            LvlMiddle[index] = 50;

            ResultSmoothFast[index] = _rsiSmoothFast.Result.Last(0);
            ResultSmoothSlow[index] = _rsiSmoothSlow.Result.Last(0);

            OverBuy[index] = _stoch1.PercentK.Last(0) > _stoch1.PercentD.Last(0) && _stoch2.PercentK.Last(0) > _stoch2.PercentD.Last(0) && _stoch3.PercentK.Last(0) > _stoch3.PercentD.Last(0) ? LevelLineHigh : double.NaN;
            OverSell[index] = _stoch1.PercentK.Last(0) < _stoch1.PercentD.Last(0) && _stoch2.PercentK.Last(0) < _stoch2.PercentD.Last(0) && _stoch3.PercentK.Last(0) < _stoch3.PercentD.Last(0) ? LevelLineLow : double.NaN;

            HighTrendUp[index] = _rsiSmoothFast.Result.Last(0) > _rsiSmoothSlow.Result.Last(0) && _rsiSmoothFast.Result.Last(0) > 50 ? LevelLineHigh : double.NaN;
            HighTrendDown[index] = _rsiSmoothFast.Result.Last(0) < _rsiSmoothSlow.Result.Last(0) && _rsiSmoothFast.Result.Last(0) < 50 ? LevelLineLow : double.NaN;

            LowTrendUp[index] = _rsiSmoothFast.Result.Last(0) > _rsiSmoothSlow.Result.Last(0) && _rsiSmoothFast.Result.Last(0) < 50 ? LevelLineHigh : double.NaN;
            LowTrendDown[index] = _rsiSmoothFast.Result.Last(0) < _rsiSmoothSlow.Result.Last(0) && _rsiSmoothFast.Result.Last(0) > 50 ? LevelLineLow : double.NaN;

        }
    }
}
YesOrNot
Joined on 10.10.2022 Blocked
- Distribution: Free
- Language: C#
- Trading platform: cTrader Automate
- File name: Rsi Stoch Srategie.algo
- Rating: 5
- Installs: 636
- Modified: 18/08/2023 14:58
