Description
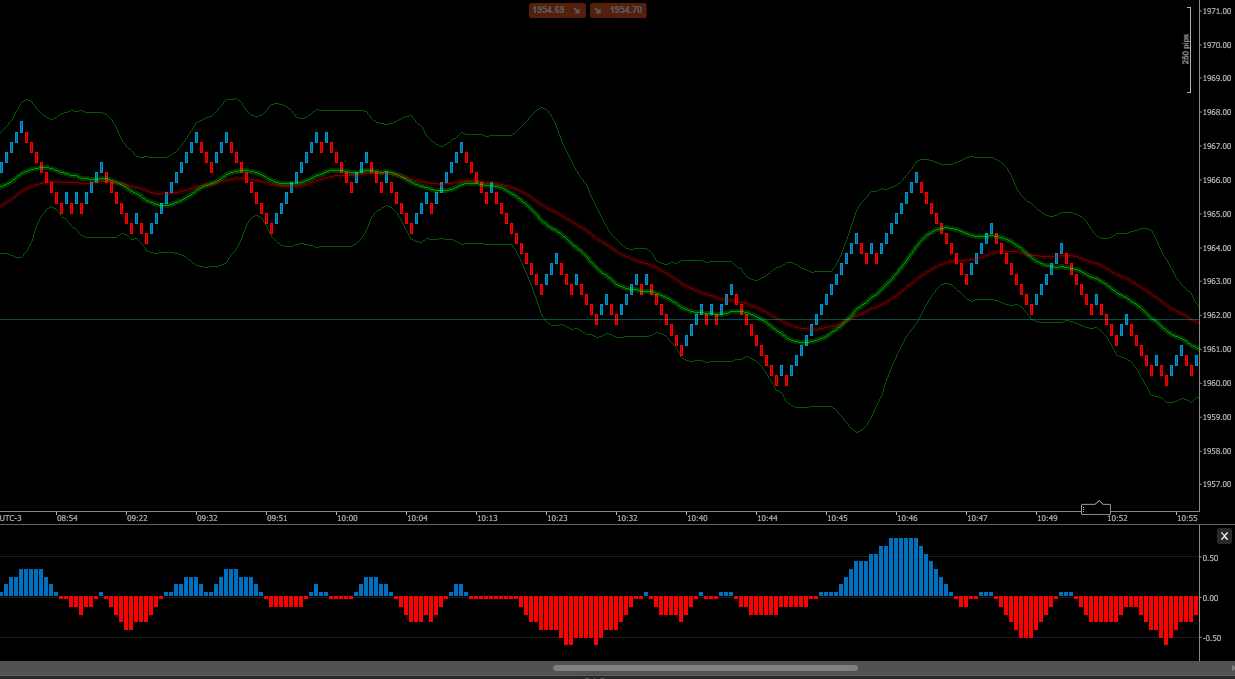
Delta Average is a indicator it calculates the average volume of the last 14 bullish bars and the last 14 bearish bars and then determines the balance between these averages.
The Delta Average indicator is designed to provide a visual and easy-to-understand view of volume flow between bullish and bearish periods in the market. It represents this balance in a histogram, where blue bars indicate a positive balance (more volume in bullish bars) and red bars indicate a negative balance (more volume in bearish bars).
With Delta Average, traders can quickly identify whether there is a dominant buying or selling pressure in the market during a particular period, which can be helpful in making informed buying or selling decisions.
It is important to remember that no indicator is a guarantee of profit in the financial market, and Delta Average should be used in conjunction with other analyses and tools to gain a comprehensive view of the market situation.
Try the Delta Average indicator on your charts to enhance your technical analysis and make more informed trading decisions. Good luck and happy trading!


The author decided to hide the source code.
nattansbb
Joined on 23.07.2023
- Distribution: Free
- Language: C#
- Trading platform: cTrader Automate
- File name: Delta Medio.algo
- Rating: 5
- Installs: 600
- Modified: 24/07/2023 21:34

It seems to function properly. But I have two problems. 1. Because the panel is positioned in the upper left corner of the chart, it is hidden under the other indicators I have there https://ctrader.com/algos/geometry dash world/indicators/show/2735. It would be good if the panel was at the upper right corner of the chart.
2. I'm unable to figure out how to change the lines inside the Gann box. For them to be helpful, I must alter their color and thickness so that they are visible.