Description
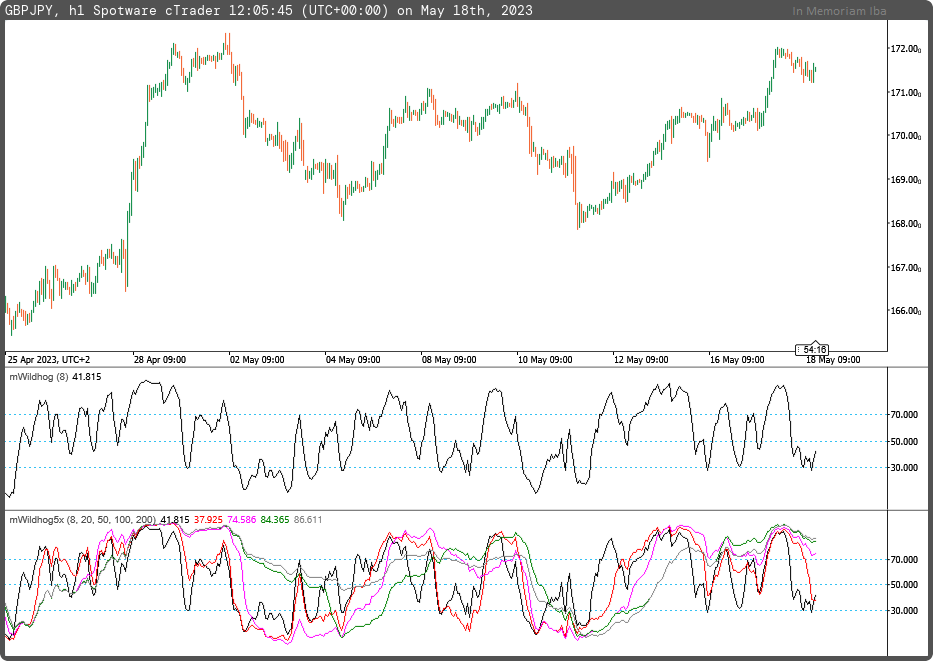
The Wildhog oscillator displays an asset's overbought/oversold states and also searches for divergences. The system is based on the highs, lows, and closing prices of the last eight bars by default period.
In this version, we use five indicator components to confirm overbought/oversold conditions.
In other words, when all indicator components are above the level of 70 and the fast component begins to return from above to below the level of 70, the overbought condition is confirmed and supply factor start to increase.
Similarly, when all indicator components are below the level of 30 and the fast component starts to return from below to above the level of 30, the oversold condition is confirmed, and demand factor start to increase.
This indicator may appear complex, but it is based on the Iba model SD. It detects the initiation of the supply or demand factor by observing the ending periods of accumulation or distribution phases.
The original indicator you can find in link: https://ctrader.com/algos/indicators/show/3423
using System;
using cAlgo.API;
using cAlgo.API.Indicators;
using cAlgo.API.Internals;

namespace cAlgo
{
    [Levels(30,70,50)]
    [Indicator(IsOverlay = false, AccessRights = AccessRights.None)]
    public class mWildhog : Indicator
    {
        [Parameter("Period (8)", DefaultValue = 8, MinValue = 2)]
        public int inpPeriod { get; set; }
        [Parameter("Period (20)", DefaultValue = 20, MinValue = 2)]
        public int inpPeriod1 { get; set; }
        [Parameter("Period (50)", DefaultValue = 50, MinValue = 2)]
        public int inpPeriod2 { get; set; }
        [Parameter("Period (100)", DefaultValue = 100, MinValue = 2)]
        public int inpPeriod3 { get; set; }
        [Parameter("Period (200)", DefaultValue = 200, MinValue = 2)]
        public int inpPeriod4 { get; set; }

        [Output("Wildhog Oscillator", LineColor = "Black", PlotType = PlotType.Line, Thickness = 1)]
        public IndicatorDataSeries outWoldhog { get; set; }
        [Output("Wildhog Oscillator 1", LineColor = "Red", PlotType = PlotType.Line, Thickness = 1)]
        public IndicatorDataSeries outWoldhog1 { get; set; }
        [Output("Wildhog Oscillator 2", LineColor = "Magenta", PlotType = PlotType.Line, Thickness = 1)]
        public IndicatorDataSeries outWoldhog2 { get; set; }
        [Output("Wildhog Oscillator 3", LineColor = "Green", PlotType = PlotType.Line, Thickness = 1)]
        public IndicatorDataSeries outWoldhog3 { get; set; }
        [Output("Wildhog Oscillator 4", LineColor = "Gray", PlotType = PlotType.Line, Thickness = 1)]
        public IndicatorDataSeries outWoldhog4 { get; set; }

        private IndicatorDataSeries _hh, _ll, _hh1, _ll1, _hh2, _ll2, _hh3, _ll3, _hh4, _ll4, _woldhog, _woldhog1, _woldhog2, _woldhog3, _woldhog4;


        protected override void Initialize()
        {
            _hh = CreateDataSeries();
            _ll = CreateDataSeries();
            _hh1 = CreateDataSeries();
            _ll1 = CreateDataSeries();
            _hh2 = CreateDataSeries();
            _ll2 = CreateDataSeries();
            _hh3 = CreateDataSeries();
            _ll3 = CreateDataSeries();
            _hh4 = CreateDataSeries();
            _ll4 = CreateDataSeries();
            _woldhog = CreateDataSeries();
            _woldhog1 = CreateDataSeries();
            _woldhog2 = CreateDataSeries();
            _woldhog3 = CreateDataSeries();
            _woldhog4 = CreateDataSeries();
        }

        public override void Calculate(int i)
        {
            _hh[i] = i>inpPeriod ? Bars.HighPrices.Maximum(inpPeriod) : Bars.HighPrices[i];
            _ll[i] = i>inpPeriod ? Bars.LowPrices.Minimum(inpPeriod) : Bars.LowPrices[i];
            _hh1[i] = i>inpPeriod ? Bars.HighPrices.Maximum(inpPeriod1) : Bars.HighPrices[i];
            _ll1[i] = i>inpPeriod ? Bars.LowPrices.Minimum(inpPeriod1) : Bars.LowPrices[i];
            _hh2[i] = i>inpPeriod ? Bars.HighPrices.Maximum(inpPeriod2) : Bars.HighPrices[i];
            _ll2[i] = i>inpPeriod ? Bars.LowPrices.Minimum(inpPeriod2) : Bars.LowPrices[i];
            _hh3[i] = i>inpPeriod ? Bars.HighPrices.Maximum(inpPeriod3) : Bars.HighPrices[i];
            _ll3[i] = i>inpPeriod ? Bars.LowPrices.Minimum(inpPeriod3) : Bars.LowPrices[i];
            _hh4[i] = i>inpPeriod ? Bars.HighPrices.Maximum(inpPeriod4) : Bars.HighPrices[i];
            _ll4[i] = i>inpPeriod ? Bars.LowPrices.Minimum(inpPeriod4) : Bars.LowPrices[i];
            _woldhog[i] = i>1
                        ? 100.0 * (Bars.ClosePrices[i] - _ll[i]) / (3.0 * (_hh[i] - _ll[i])) + _woldhog[i-1] / 1.5
                        : 100.0 * (Bars.ClosePrices[i] - _ll[i]) / (3.0 * (_hh[i] - _ll[i]));
            _woldhog1[i] = i>1
                        ? 100.0 * (Bars.ClosePrices[i] - _ll1[i]) / (3.0 * (_hh1[i] - _ll1[i])) + _woldhog1[i-1] / 1.5
                        : 100.0 * (Bars.ClosePrices[i] - _ll1[i]) / (3.0 * (_hh1[i] - _ll1[i]));
            _woldhog2[i] = i>1
                        ? 100.0 * (Bars.ClosePrices[i] - _ll2[i]) / (3.0 * (_hh2[i] - _ll2[i])) + _woldhog2[i-1] / 1.5
                        : 100.0 * (Bars.ClosePrices[i] - _ll2[i]) / (3.0 * (_hh2[i] - _ll2[i]));
            _woldhog3[i] = i>1
                        ? 100.0 * (Bars.ClosePrices[i] - _ll3[i]) / (3.0 * (_hh3[i] - _ll3[i])) + _woldhog3[i-1] / 1.5
                        : 100.0 * (Bars.ClosePrices[i] - _ll3[i]) / (3.0 * (_hh3[i] - _ll3[i]));
            _woldhog4[i] = i>1
                        ? 100.0 * (Bars.ClosePrices[i] - _ll4[i]) / (3.0 * (_hh4[i] - _ll4[i])) + _woldhog4[i-1] / 1.5
                        : 100.0 * (Bars.ClosePrices[i] - _ll4[i]) / (3.0 * (_hh4[i] - _ll4[i]));

            outWoldhog[i] = _woldhog[i];
            outWoldhog1[i] = _woldhog1[i];
            outWoldhog2[i] = _woldhog2[i];
            outWoldhog3[i] = _woldhog3[i];
            outWoldhog4[i] = _woldhog4[i];
        }
    }
}
mfejza
Joined on 25.01.2022
- Distribution: Free
- Language: C#
- Trading platform: cTrader Automate
- File name: mWildhog5x.algo
- Rating: 5
- Installs: 640
- Modified: 18/05/2023 11:56

Comments
thanks to ctrader.guru and Jim Tollan for revision the indicator output results.
we should create a close community to cooperate close for finding solutions together.
if any of you has any idea please let me know
whao - this indicator literally wraps up a lot of the insights that i've been trying to *capture* regards supply and demand zones. or rather should i say, this targets those zones in a completely diffetent way without having to map out the zones. i think this has huge potential to provide high quality entry/exits based on your descriptions.
will let you know how it goes... thanks for sharing
Great explanation! The Wildhog oscillator seems to provide a comprehensive analysis of overbought/oversold conditions with multiple indicator components. It's impressive how it detects supply and demand factors based on accumulation or distribution phases. I agree, this indicator is worth exploring. Thanks for sharing! #Trading #Analysis
i'm just trying to think about adding either a Fractals or a Divergence indicator for confirmation/confluence. again - WIP!!