Description
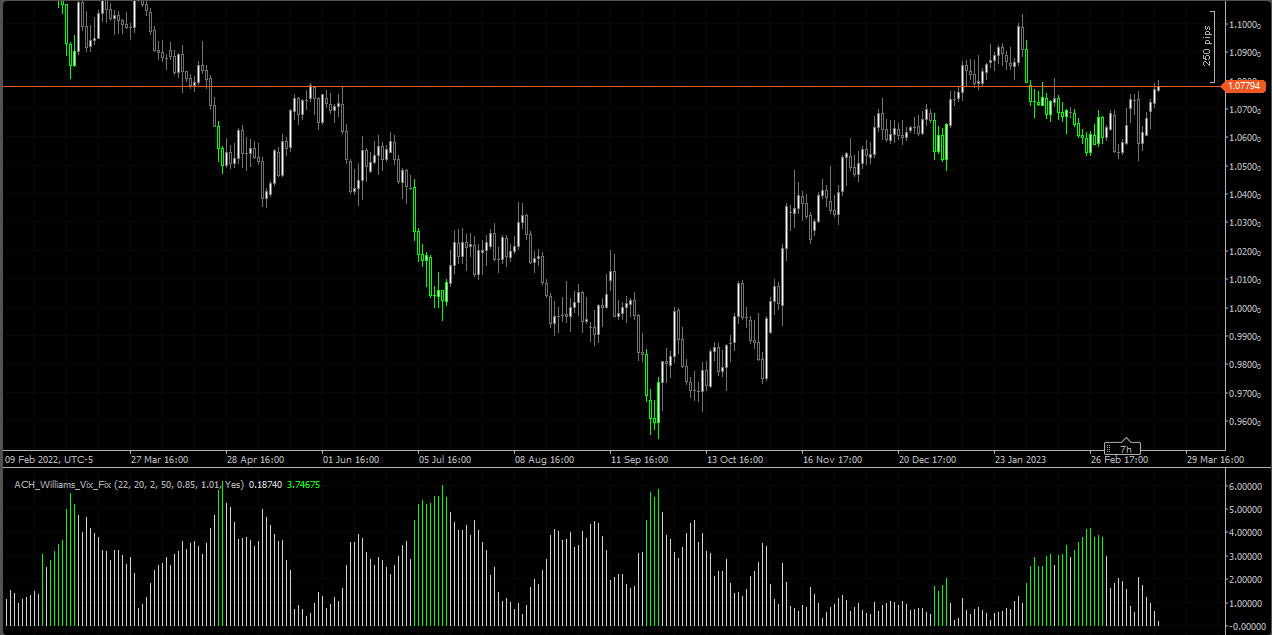
This indicator is the ctrader version of the famous CM_Williams_Vix_Fix indicator. And I saw that it was used a lot in tradingview. That's why I created it for ctrader users to use.
-------------------------------
WilliamsVixFix indicator was invented back in 2007 when the well-known trader and “indicator innovator” Larry Williams wrote an article in Active Trader about VIX and how you can create your synthetic VIX for any security you like.
It was introduced in 1993 and is intended to represent the “fear” or “complacency” of the market. Unfortunately, the VIX is only calculated for the S&P 500, Nasdaq, and the Dow Jones 30.
When the VIX is high, it shows fear is high and vice versa. A high VIX normally means the market has fallen, at least in the short term, and the risk premium for owning stocks increases.
The formula for Williams VixFix is as follows:
Formula VIX Fix = (Highest (Close,22) – Low) / (Highest (Close,22)) * 100
***Combining Williams Vix Fix with Bollinger Bands can help us find trend reversal points***
If you have any problem with how to work with this indicator, contact me.
Notice:It does not guarantee any particular outcome or profit of any kind. Please enjoy trading at your own risk.
I can also take orders for algorithm development.
using cAlgo.API;
using cAlgo.API.Indicators;

namespace cAlgo.Indicators
{
    [Indicator(IsOverlay = false, AccessRights = AccessRights.None)]
    public class BollingerBands2 : Indicator
    {
        private MovingAverage _movingAverage;
        private StandardDeviation _standardDeviation;

        [Parameter("LookBack Period Standard Deviation High", DefaultValue = 22)]
        public int Pd { get; set; }

        [Parameter("Bolinger Band Length", DefaultValue = 20)]
        public int bbl { get; set; }


        [Parameter("Bollinger Band Standard Devaition Up", DefaultValue = 2)]
        public int mult { get; set; }
        //------------------------------
        [Parameter("Look Back Period Percentile High", DefaultValue = 50)]
        public int lb { get; set; }

        [Parameter("Highest Percentile - 0.90=90%, 0.95=95%, 0.99=99%", DefaultValue = 0.85)]
        public double ph { get; set; }

        [Parameter("Lowest Percentile - 1.10=90%, 1.05=95%, 1.01=99%", DefaultValue = 1.01)]
        public double pl { get; set; }

        [Parameter("Show on Candles?", DefaultValue = true)]
        public bool Show_Candles { get; set; }


        [Output("wvf", LineColor = "LightGray", PlotType = PlotType.Histogram)]
        public IndicatorDataSeries wvf { get; set; }

        [Output("Strong_wvf", LineColor = "Lime", PlotType = PlotType.Histogram)]
        public IndicatorDataSeries Strong_wvf { get; set; }

        /*[Output("High Range", LineColor = "Orange", PlotType = PlotType.Histogram)]
        public IndicatorDataSeries hp { get; set; }

        [Output("Standard Deviation Line", LineColor = "Aqua", PlotType = PlotType.Histogram)]
        public IndicatorDataSeries sd { get; set; }
                [Parameter("Show High Range - Based on Percentile and LookBack Period?", DefaultValue = false)]
        public bool sd_line { get; set; }

        [Parameter("Show Standard Deviation Line?", DefaultValue = false)]
        public bool hp_line { get; set; }
        */

        public double sDev = 0.0;
        public double rangeHigh = 0.0;
        public double rangeLow = 0.0;

        public double midLine { get; set; }
        public double upperBand { get; set; }
        public double lowerBand { get; set; }

        protected override void Initialize()
        {
            //Color.LightGray

        }


        public override void Calculate(int index)
        {

            wvf[index] = ((Bars.ClosePrices.Maximum(Pd) - Bars.LowPrices[index]) / (Bars.ClosePrices.Maximum(Pd))) * 100;

            _standardDeviation = Indicators.StandardDeviation(wvf, bbl, MovingAverageType.Simple);
            _movingAverage = Indicators.MovingAverage(wvf, bbl, MovingAverageType.Simple);

            sDev = mult * _standardDeviation.Result[index];
            midLine = _movingAverage.Result[index];
            lowerBand = midLine - sDev;
            upperBand = midLine + sDev;

            rangeHigh = wvf.Maximum(lb) * ph;
            rangeLow = wvf.Minimum(lb) * pl;

            if ((wvf[index] >= upperBand) || (wvf[index] >= rangeHigh))
            {
                if (Show_Candles)
                {
                   Chart.SetBarOutlineColor(index, Color.Lime);
                }

                Strong_wvf[index] = wvf[index];
            }

        }
    }
}
AlgoCreators
Joined on 16.01.2022
- Distribution: Free
- Language: C#
- Trading platform: cTrader Automate
- File name: ACH_Williams_Vix_Fix.algo
- Rating: 5
- Installs: 1042
- Modified: 22/03/2023 13:06

great! Thanks for adding this to CTrader