Description
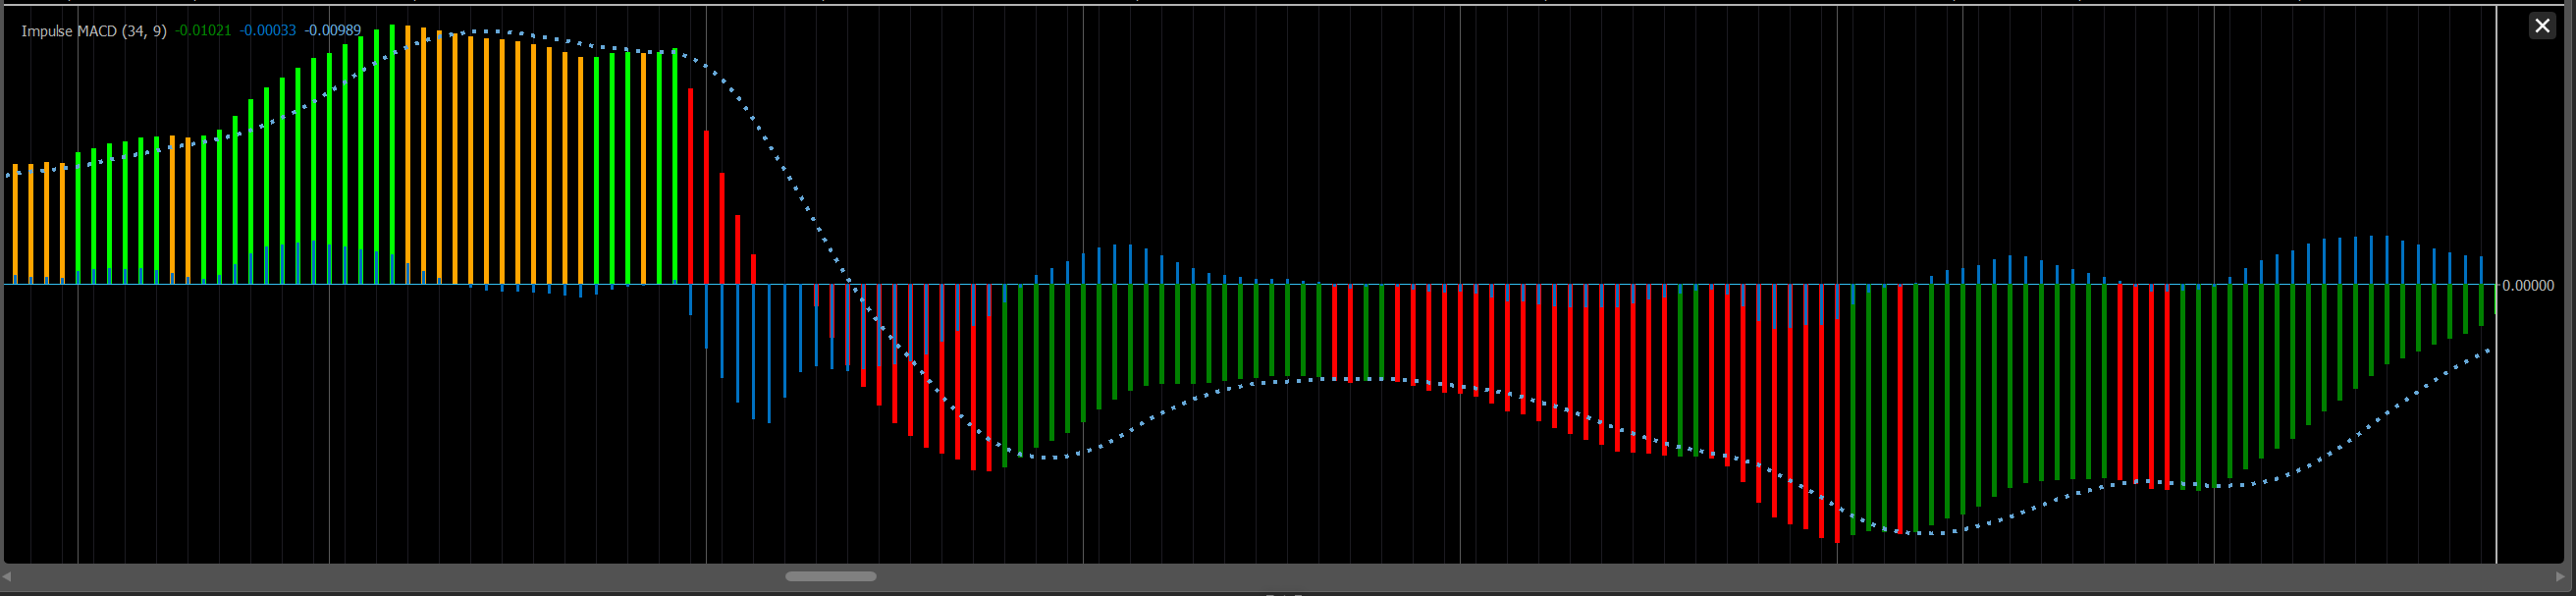
This is an implementation of the Impulse MACD - in particular the Lazy Bear variant with its colour scheme and additional MACD signal.
Buy and sell signals can be taken when the coloured histograms are further from zero than the signal line.
Revision 1 (27th March 2023)
- Lazy Bear does not name his outputs (they are simply colour coded), but it has been pointed out that the Strong Up Trend and Weak Up Trend outputs may be named incorrectly.
These two outputs have had their Lines names swapped (Lime = "Strong Up Trend", Green = "Weak Up Trend").
This change does not change any other features - the histogram remains the same, as does the displayed colours and the signal line and its histogram.
using cAlgo.API;
using cAlgo.API.Indicators;
using System.Reflection.Metadata;

namespace cAlgo.Indicators
{
    /// <summary>
    /// cTrader implementation of the Impulse MACD
    /// Original: https://www.tradingview.com/script/qt6xLfLi-Impulse-MACD-LazyBear/
    /// </summary>

    [Levels(0)]
    [Indicator(IsOverlay = false, AccessRights = AccessRights.None, TimeZone = TimeZones.UTC)]
    public class ImpulseMACD : Indicator
    {
        #region Output
        [Output("Strong Up Trend", LineColor = "Lime", Thickness = 5, PlotType = PlotType.Histogram)]
        public IndicatorDataSeries StrongUpTrend { get; set; }

        [Output("Weak Up Trend", LineColor = "Green", Thickness = 5, PlotType = PlotType.Histogram)]
        public IndicatorDataSeries WeakUpTrend { get; set; }

        [Output("Weak Down Trend", LineColor = "Orange", Thickness = 5, PlotType = PlotType.Histogram)]
        public IndicatorDataSeries WeakDownTrend { get; set; }

        [Output("Strong Down Trend", LineColor = "Red", Thickness = 5, PlotType = PlotType.Histogram)]
        public IndicatorDataSeries StrongDownTrend { get; set; }

        [Output("Signal Histogram", LineColor = "#FF0071C1", Thickness = 3, PlotType = PlotType.Histogram)]
        public IndicatorDataSeries SignalHistogram { get; set; }

        [Output("Signal", LineColor = "#FF66A8D8", Thickness = 4, LineStyle = LineStyle.Dots)]
        public IndicatorDataSeries Signal { get; set; }
        #endregion

        #region Parameters
        [Parameter("Length", DefaultValue = 34, MinValue = 1)]
        public int Length { get; set; }

        [Parameter("Signal Length", DefaultValue = 9, MinValue = 1)]
        public int SignalLength { get; set; }
        #endregion

        private TypicalPrice typicalPrice;
        private MovingAverage zlema1, zlema2, highMA, lowMA, signalMA;
        private IndicatorDataSeries macdBuffer;

        protected override void Initialize()
        {
            macdBuffer = CreateDataSeries();

            typicalPrice = Indicators.TypicalPrice();
            zlema1 = Indicators.ExponentialMovingAverage(typicalPrice.Result, Length);
            zlema2 = Indicators.ExponentialMovingAverage(zlema1.Result, Length);
            highMA = Indicators.WellesWilderSmoothing(Bars.HighPrices, Length);
            lowMA = Indicators.WellesWilderSmoothing(Bars.LowPrices, Length);
            signalMA = Indicators.SimpleMovingAverage(MACD, SignalLength);
        }

        public override void Calculate(int index)
        {
            // Ensure any redrawing starts with a blank slate
            WeakUpTrend[index] = double.NaN;
            StrongUpTrend[index] = double.NaN;
            StrongDownTrend[index] = double.NaN;
            WeakDownTrend[index] = double.NaN;

            var high = highMA.Result[index];
            var low = lowMA.Result[index];
            var mid = 2 * zlema1.Result[index] - zlema2.Result[index];

            macdBuffer[index] = (mid > high) ? (mid - high) : (mid < low) ? (mid - low) : 0;
            SignalHistogram[index] = macdBuffer[index] - signalMA.Result[index];
            Signal[index] = signalMA.Result[index];

            var histogram = typicalPrice.Result[index] > mid ? typicalPrice.Result[index] > high ? StrongUpTrend : WeakUpTrend : typicalPrice.Result[index] < low ? StrongDownTrend : WeakDownTrend;
            histogram[index] = MACD[index];
        }

        public DataSeries MACD => macdBuffer;
    }
}
FuryPilot
Joined on 07.03.2023
- Distribution: Free
- Language: C#
- Trading platform: cTrader Automate
- File name: Impulse MACD.algo
- Rating: 5
- Installs: 2066
- Modified: 27/03/2023 06:13

Comments
I believe you have a bug in your code on this line:
var histogram = typicalPrice.Result[index] > mid ? typicalPrice.Result[index] > high ? WeakUpTrend : StrongUpTrend : typicalPrice.Result[index] < low ? StrongDownTrend : WeakDownTrend;
It should be:
var histogram = typicalPrice.Result[index] > mid ? typicalPrice.Result[index] > high ? StrongUpTrend : WeakUpTrend : typicalPrice.Result[index] < low ? StrongDownTrend : WeakDownTrend;
because if the typical price is greater than the high, that's "strong", not "weak" just like when the typical price less than the low that's "strong" too. :-)
I'll have a look.
In my normal colour scheme for other indicators Strengthening are the darker colours, while Weakening are the lighter colours. My naming convention here may be wrong as LazyBear treats them differently, but the output colors should be as the tradingview version.
The LazyBear code is : mdc=src>mi?src>hi?lime:green:src<lo?red:orange
which should correspond to (WeakUp, StrongUp, StrongDown, WeakDown) above.