Warning! This section will be deprecated on February 1st 2025. Please move all your Indicators to the cTrader Store catalogue.
Description
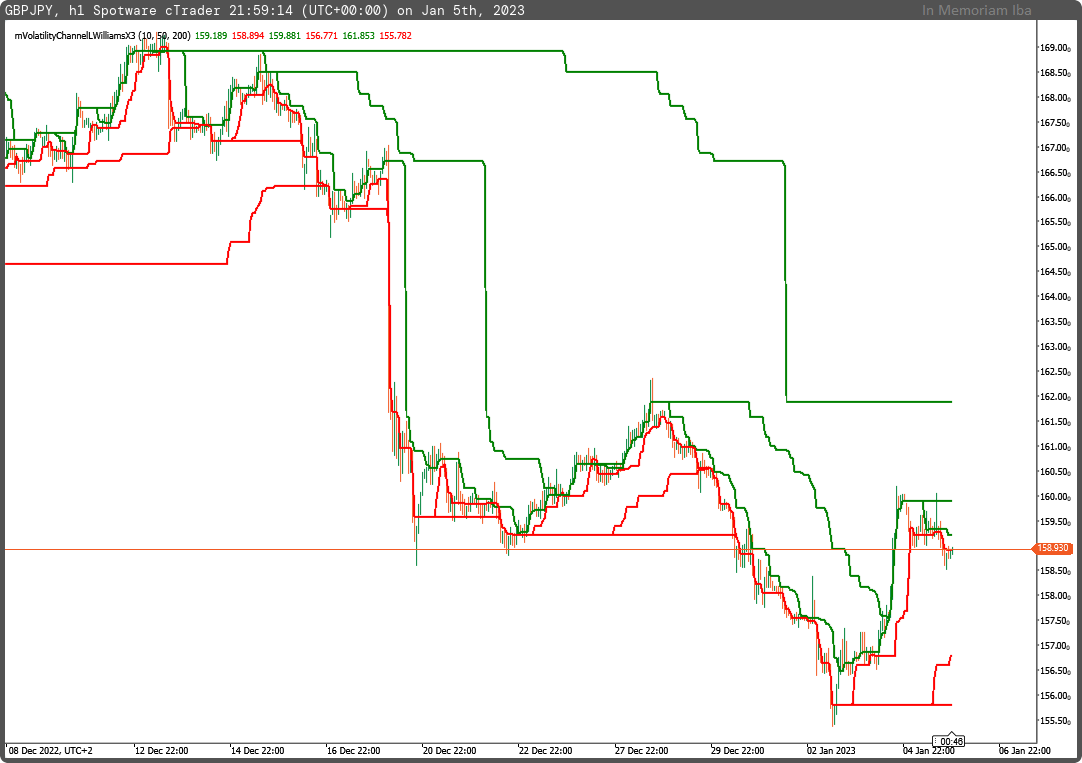
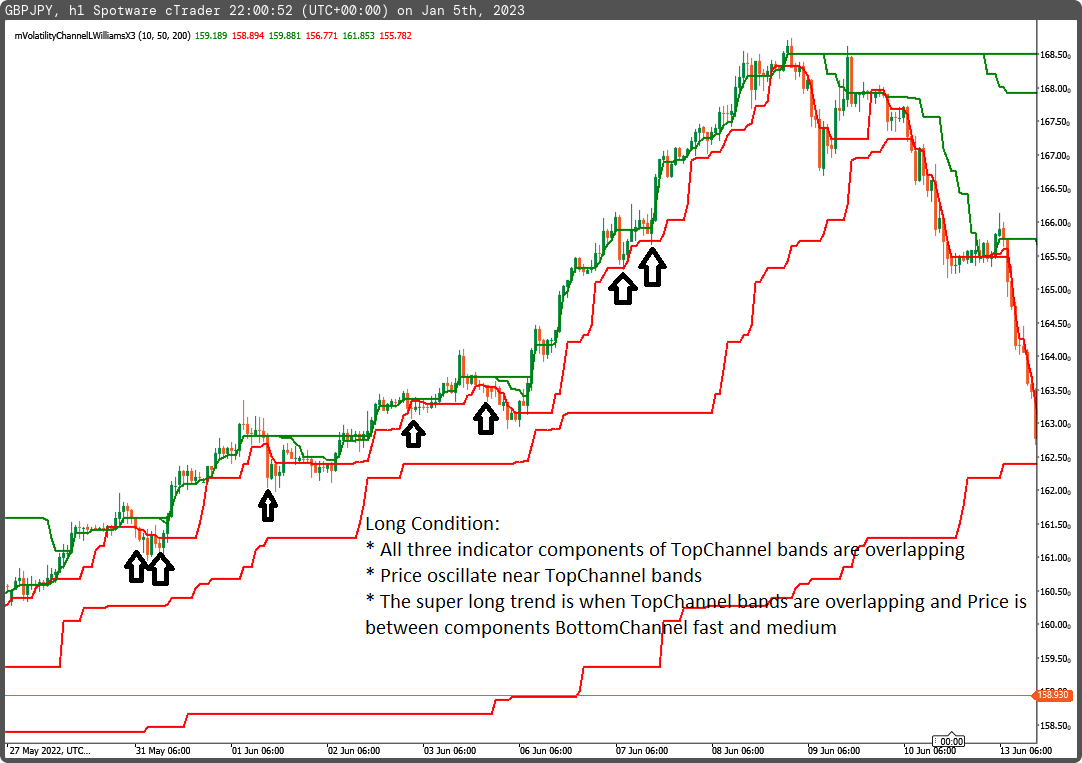
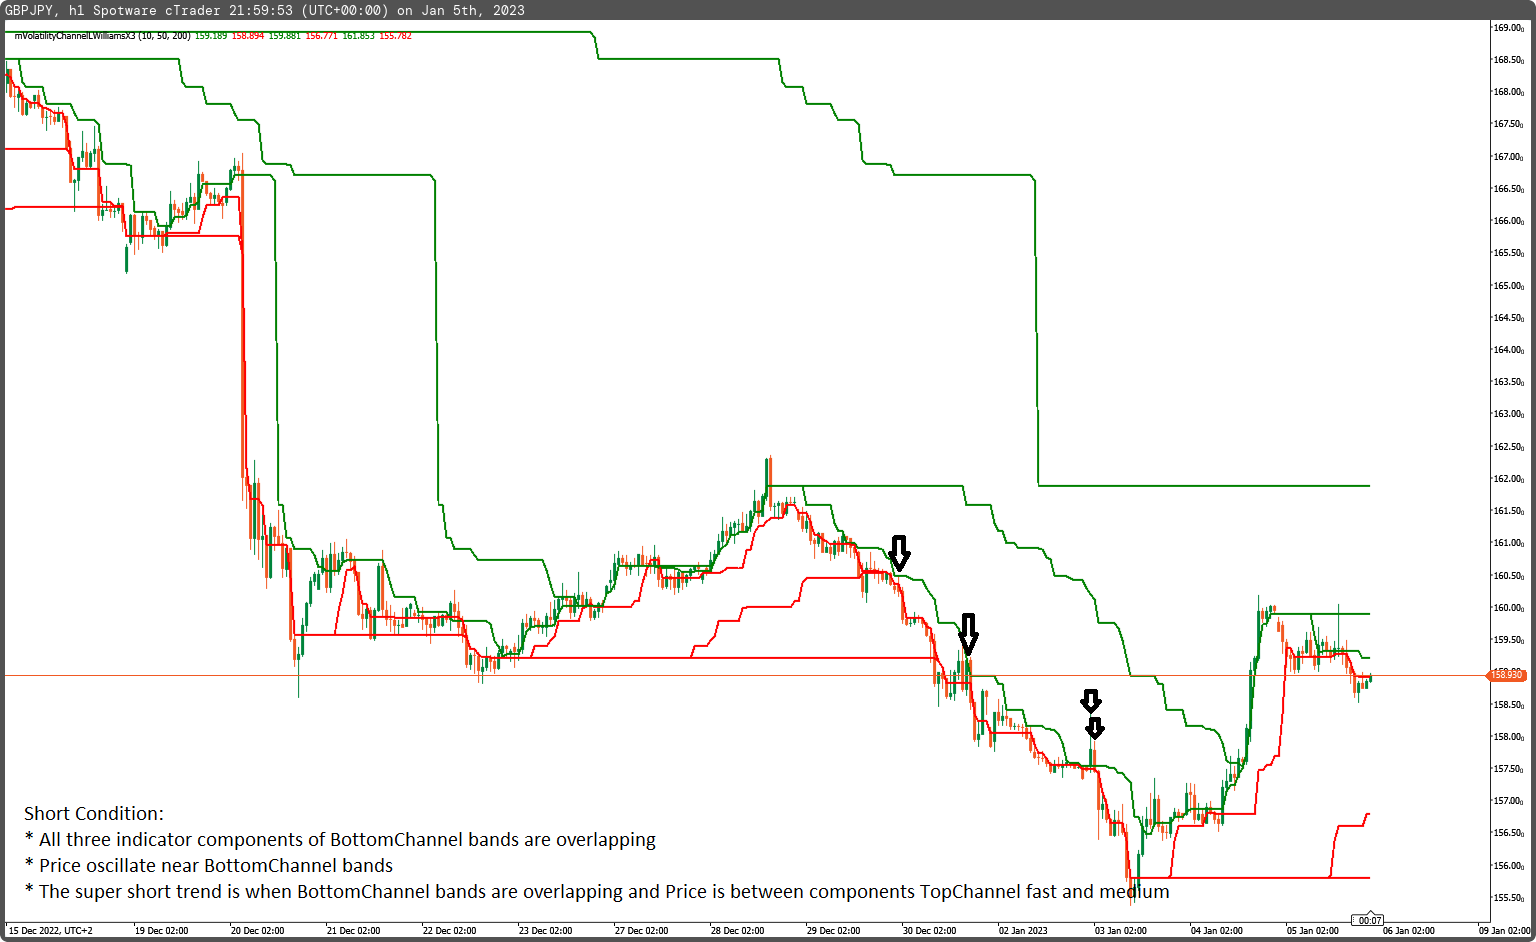
Volatility Channel by Larry Williams indicator x3
Note, increase calculation periods, to increase projection (in bars)
In this version is easy to read and identify trend; also discount and premium price levels)


using System;
using cAlgo.API;
using cAlgo.API.Collections;
using cAlgo.API.Indicators;
using cAlgo.API.Internals;

namespace cAlgo
{
    [Indicator(IsOverlay = true, TimeZone = TimeZones.UTC, AccessRights = AccessRights.None)]
    public class mVolatilityChannelLWilliams : Indicator
    {
        [Parameter("Fast Periods (10)", DefaultValue = 10)]
        public int inpPeriodsFast { get; set; }
        [Parameter("Medium Periods (50)", DefaultValue = 50)]
        public int inpPeriodsMedium { get; set; }
        [Parameter("Slow Periods (200)", DefaultValue = 200)]
        public int inpPeriodsSlow { get; set; }

        [Output("Volatility Channel Top f", LineColor = "Green", PlotType = PlotType.Line, Thickness = 2)]
        public IndicatorDataSeries outVolatilityChannelTopf { get; set; }
        [Output("Volatility Channel Bottom f", LineColor = "Red", PlotType = PlotType.Line, Thickness = 2)]
        public IndicatorDataSeries outVolatilityChannelBottomf { get; set; }
        [Output("Volatility Channel Top m", LineColor = "Green", PlotType = PlotType.Line, Thickness = 2)]
        public IndicatorDataSeries outVolatilityChannelTopm { get; set; }
        [Output("Volatility Channel Bottom m", LineColor = "Red", PlotType = PlotType.Line, Thickness = 2)]
        public IndicatorDataSeries outVolatilityChannelBottomm { get; set; }
        [Output("Volatility Channel Top s", LineColor = "Green", PlotType = PlotType.Line, Thickness = 2)]
        public IndicatorDataSeries outVolatilityChannelTops { get; set; }
        [Output("Volatility Channel Bottom s", LineColor = "Red", PlotType = PlotType.Line, Thickness = 2)]
        public IndicatorDataSeries outVolatilityChannelBottoms { get; set; }

        private IndicatorDataSeries _traw, _braw, _topfast, _bottomfast, _topmedium, _bottommedium, _topslow, _bottomslow;


        protected override void Initialize()
        {
            _traw = CreateDataSeries();
            _braw = CreateDataSeries();
            _topfast = CreateDataSeries();
            _bottomfast = CreateDataSeries();
            _topmedium = CreateDataSeries();
            _bottommedium = CreateDataSeries();
            _topslow = CreateDataSeries();
            _bottomslow = CreateDataSeries();
        }

        public override void Calculate(int i)
        {
            _traw[i] = 2.0 * Bars.TypicalPrices[i] - Bars.HighPrices[i];
            _braw[i] = 2.0 * Bars.TypicalPrices[i] - Bars.LowPrices[i];

            _topfast[i] = i>inpPeriodsFast ? Math.Max(_traw.Maximum(inpPeriodsFast), _traw[i]) : Bars.HighPrices[i];
            _bottomfast[i] = i>inpPeriodsFast ? Math.Min(_braw.Minimum(inpPeriodsFast), _braw[i]) : Bars.LowPrices[i];
            _topmedium[i] = i>inpPeriodsMedium ? Math.Max(_traw.Maximum(inpPeriodsMedium), _traw[i]) : Bars.HighPrices[i];
            _bottommedium[i] = i>inpPeriodsMedium ? Math.Min(_braw.Minimum(inpPeriodsMedium), _braw[i]) : Bars.LowPrices[i];
            _topslow[i] = i>inpPeriodsSlow ? Math.Max(_traw.Maximum(inpPeriodsSlow), _traw[i]) : Bars.HighPrices[i];
            _bottomslow[i] = i>inpPeriodsSlow ? Math.Min(_braw.Minimum(inpPeriodsSlow), _braw[i]) : Bars.LowPrices[i];

            outVolatilityChannelTopf[i] = _topfast[i];
            outVolatilityChannelBottomf[i] = _bottomfast[i];
            outVolatilityChannelTopm[i] = _topmedium[i];
            outVolatilityChannelBottomm[i] = _bottommedium[i];
            outVolatilityChannelTops[i] = _topslow[i];
            outVolatilityChannelBottoms[i] = _bottomslow[i];
        }
    }
}
mfejza
Joined on 25.01.2022
- Distribution: Free
- Language: C#
- Trading platform: cTrader Automate
- File name: mVolatilityChannelLWilliamsX3.algo
- Rating: 5
- Installs: 456
- Modified: 05/01/2023 22:16
Note that publishing copyrighted material is strictly prohibited. If you believe there is copyrighted material in this section, please use the Copyright Infringement Notification form to submit a claim.
Comments
Log in to add a comment.
No comments found.
