Description
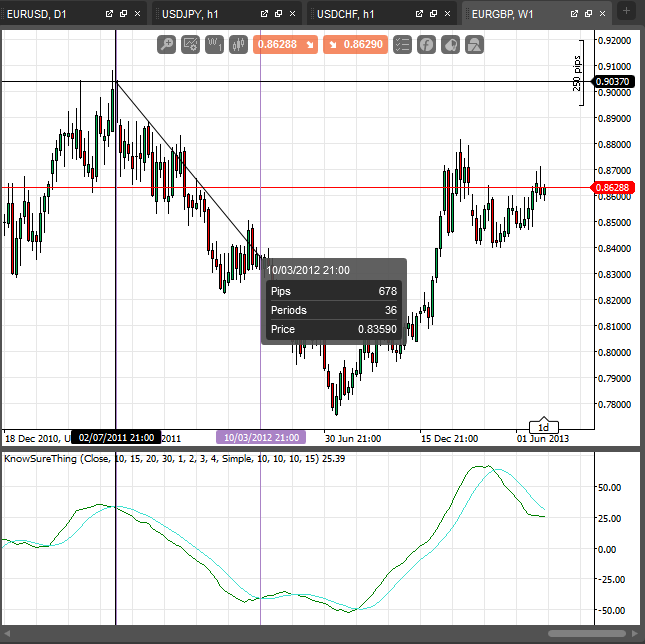
The know sure thing (KST) oscillator is a complex, smoothed price velocity indicator developed by Martin J. Pring.
A rate of change (ROC) indicator is the foundation of KST indicator. KST indicator is useful to identify major stock market cycle junctures because its formula is weighed to be more greatly influenced by the longer and more dominant time spans, in order to better reflect the primary swings of stock market cycle.[3] The concept behind the oscillator is that price trends are determined by the interaction of many different time cycles and that important trend reversals take place when a number of price trends are simultaneously changing direction.
Entry rules KST Indicator
When KST crosses below its 9 day exponential average, short at the next day opening price.
Exit rules KST indicator
When KST crosses above its 9 day exponential average, close short position at the next day opening price.[4]
[http://en.wikipedia.org/wiki/KST_oscillator]
Works best with W1 and M1 Timeframes.
u
gorin
Joined on 16.07.2013
- Distribution: Free
- Language: C#
- Trading platform: cTrader Automate
- File name: KST oscillator.algo
- Rating: 5
- Installs: 4187
- Modified: 13/10/2021 09:54

Comments
Hello CAlgo_Fanatic/Gorin,
I have no troubles in downloading/installing indicators (I am an expert in downloading and Installing).
The problem is I have installed the indicator but cant see the blue ema on the Indicator (pictured above) ??
It would be easier if the E.M.A was coded into the indicator code by yourselves as I and other people have no qualifications for.
There you go MrTrader.
I have to say, you were very polite in your request...

In order to install an indicator please follow the instructions found when you click the "How To Install" link found under the Headline Indicators in the Indicators List Page (Top Left - under the Gray Notification)
Let us know if you require additional help downloading and installing indicators/robots
I can not add the code please update the dll
HEY MR GORIN,
You would make peoples life easier if you added the blue EMA to the code (some people dont know how to code)!!
The blue line is just the 9 day EMA of the KST you can add it on the chart, but you can include it in the code as well.
Add the following to the code:
...
[Output("Ema", Color = Colors.Blue)]
public IndicatorDataSeries Ema { get; set; }
private ExponentialMovingAverage ema;
...
protected override void Initialize()
{
...
ema = Indicators.ExponentialMovingAverage(Result, 9);
}
public override void Calculate(int index)
{
Result[index] = ...
Ema[index] = ema.Result[index];
}
where is the blue line?
Hello Mr. Gorin!
Can you makke cbot based upon KST?
KST histogram= difference between BLUE and GREEN line.
If histogram is greater than X and less than Y = BUY
If histogram is less than A and greater than B = SELL