Description
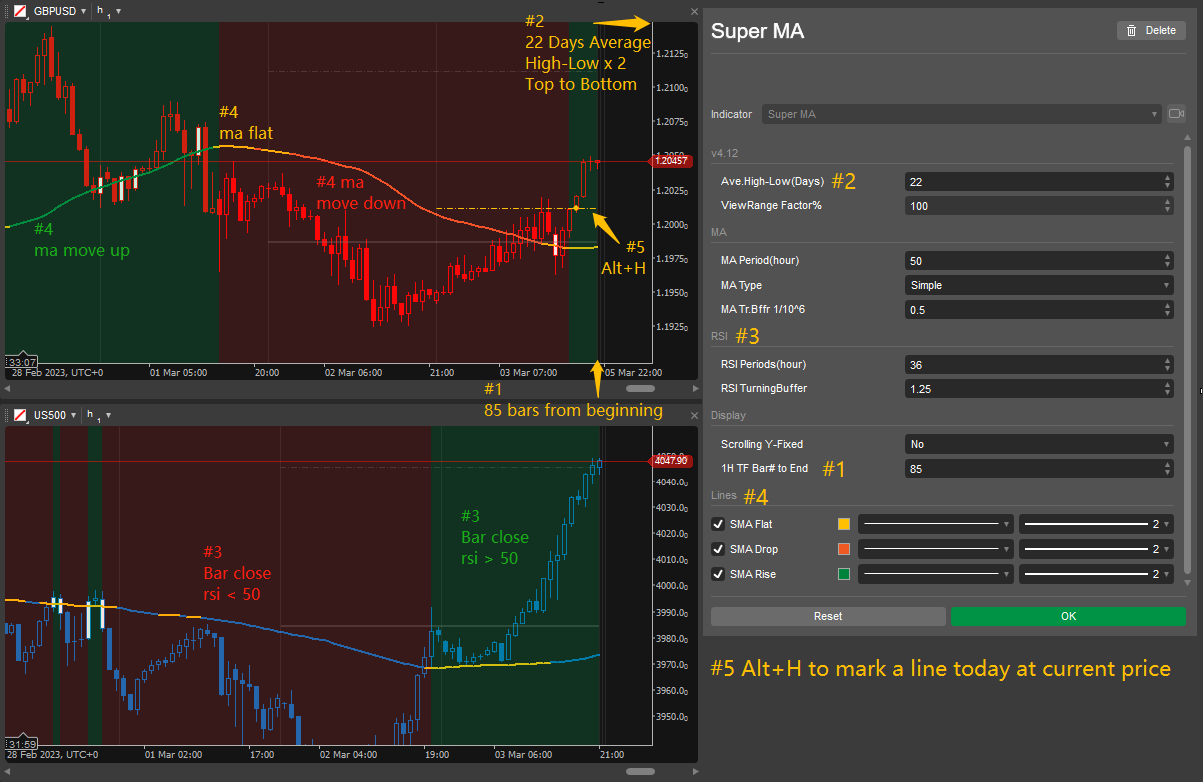
- Display Period-Fixed MA across All TimeFrames;
- Display MA up, down or flat in different colours;
- Display green/red background as RSI up or down 50.0;
- Highlight Bar when the price is crossing MA (refresh every 5 mins);
- Customised bar colour for FX pairs, Oil, Gold and some stocks;
- Fixed X-axis with user-defined bar numbers, and daily auto-refreshing;
- AutoSet Y-Axis viewable range according to chart timeframe;
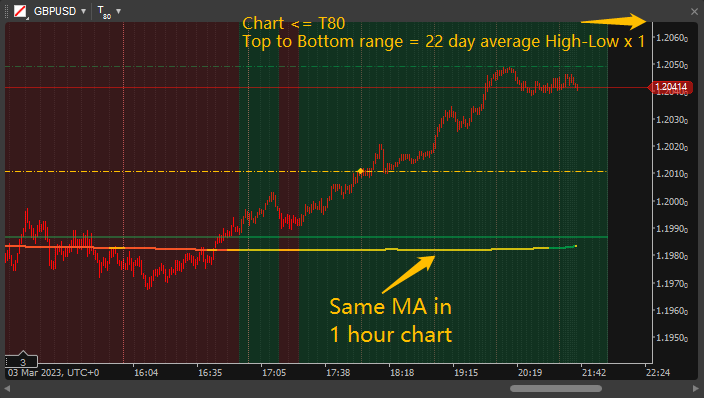
- 22 Days Ave.High-Low (200% TF.Hour~Tick90, 100% Tick80 or lower);
- Reset Y-Axis when chart zooming or scrolling (user define);
- Alt + H to mark a trendline at the last price level within the current trading day, ESC to remove;
- Alt + R to remove trendlines of today and the previous day;
- Alt + E to remove all trendlines except recent 2 days;
- Alt + 8 switch timeframe to 80Tick, Alt + 9 to TF 5 minute, Alt + 0 to TF 1Hour;
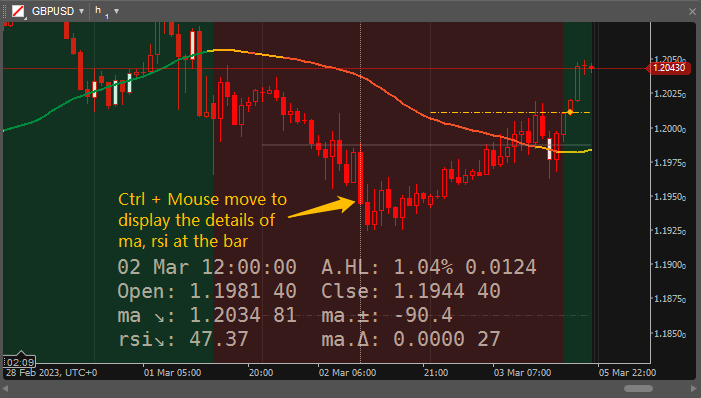
- Ctrl + MouseMove popup value of indicators at the bar with a vertical line;
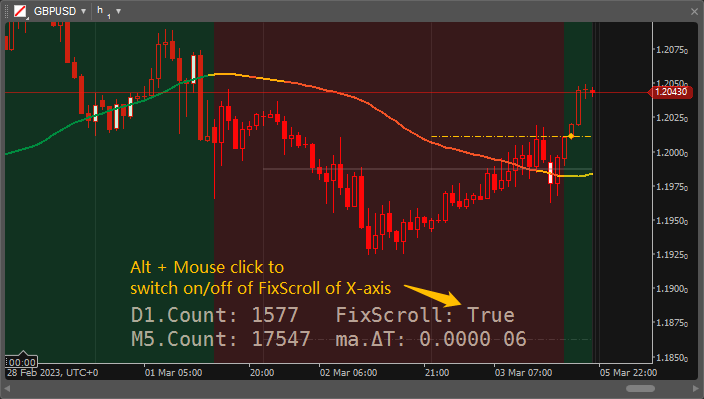
- Alt + MouseClick turn on/off X-Axis fixing, free-scrolling;
- Framework .NET 6.0 ready, Source code is compatible with .NET 4.0;
Note: 1. The attachment .algo is compiled by .NET6.0, to run with the old version (4.1.17), please copy the
source code to your local cTrader and compile it to fit your environment.
2. Recommend working with Day Separator and Session Lighter a chart assistant work as an indicator;
3. Here is a Youtube Link to a professional trader on how to use this kind of indicator in her daily trading.
4. Get more captain's indicator links at Telegram Group: cTrader FOREX Club
Alt + 8 to switch TF to Tick80, viewable range change to 100% 22 days Average High/Low price range.
(Vertical dot-lines are 5Minutes-Grey and Hourly-Coloured, by Day Separator and Session Lighter )
Ctrl + Mouse move to display the details of ma, rsi at the mouse pointing bar;
Alt + Mouse click to switch On/Off of FixScroll of X-axis.
using System;
using System.IO;
using System.Linq;
using cAlgo.API;
using cAlgo.API.Internals;
using cAlgo.API.Indicators;
//v4.01 Optimise : Rewrite from scratch;
//v4.02 Optimise : Rsi Background calculation with MA filters(Flat,Up,Down), MA crossing signal plot and restore every 5 minutes;
//v4.03 : ...
//v4.04 Optimise : SetViewRange 22 Days HL, 200% zoom out on TimeFrame shorter than Tick80;
//v4.05 Optimise : BarFillColor after Bar crossing MA;
//v4.06 Add Function: Alt+H Draw a HorizentalLine to mark PriceLevel; Alt+8: TimeFrame 80Tick; Alt+0: TimeFrame 1Hour;
//v4.07 Optimise : Debug errors in .NET6;
//v4.08 Optimise : Initialize RSI background at Tick80;
//v4.09 Add Function: BarFillColor + USDCNH (Red,Yellow); Alt+9: TimeFrame Minute5;
// Add Function: Auto-Scroll to Strength Meter's ResetPoint;
// Optimise : Crossing Signal only apply to same side of RSI status;
//v4.10 Optimise : All constants move to header kept in variables; .Net6 ready;
//v4.11 Optimise : Bars' signal use rsi latest m5 series within a chart bar;
//v4.12 Optimise : Alt+H draw a (ToCP) Trendline of Current Price level to replace horizentalline
// Add Function: ESC to remove ToCP of today, Alt+R remove Today and Yesterday ToCP, Alt+E remove All ToCP before 2 days ago;
//v4.13 Optimise : Add more symbol code to Oil and Equities, mainly from Varianse and ICMarkets;
// Optimise : SetViewRange 22 Days HL, 200% zoom out on TimeFrame shorter than Tick80, (100% zoom out when ChartZoom=5%)
namespace cAlgo
{
[Indicator(IsOverlay = true, TimeZone = TimeZones.UTC, AccessRights = AccessRights.None)]
public class SuperZip : Indicator
{
[Parameter("Ave.High-Low(Days)",DefaultValue = 22, MaxValue = 50, MinValue = 1, Step = 1, Group = "v4.13" )] public double AHL_Pd { get; set; }
[Parameter("ViewRange Factor%", DefaultValue = 100, MaxValue = 300, MinValue = 0, Step = 5, Group = "v4.13" )] public double VRFactr { get; set; }
[Parameter("MA Period(hour)", DefaultValue = 50, Group = "MA" )] public int SMA_Pd { get; set; }
[Parameter("MA Type", DefaultValue = MovingAverageType.Simple, Group = "MA" )] public MovingAverageType SMA_Type { get; set; }
[Parameter("MA Tr.Bffr 1/10^6", DefaultValue = 0.5, MaxValue = 10, MinValue = 0, Step = 0.1, Group = "MA" )] public double SMA_TrBf { get; set; }
[Parameter("RSI Periods(hour)", DefaultValue = 36, MaxValue = 2400, MinValue = 1, Step = 1, Group = "RSI" )] public int RSI_Pd { get; set; }
[Parameter("RSI TurningBuffer", DefaultValue = 1.25,MaxValue = 5, MinValue = 0, Step = 0.25,Group = "RSI" )] public double RSI_Bf { get; set; }
[Parameter("Scrolling Y-Fixed", DefaultValue = false, Group = "Display" )] public bool FixScrl { get; set; }
[Parameter("1H TF Bar# to End", DefaultValue = 60, MaxValue = 1000, MinValue = 0, Group = "Display" )] public int ChrtBrN { get; set; }
[Output("SMA Flat", LineColor = "#FFFFC000", Thickness = 2, PlotType = PlotType.DiscontinuousLine)] public IndicatorDataSeries SMA_Move { get; set; } //Yellow-Flat
[Output("SMA Drop", LineColor = "#FFF15923", Thickness = 2, PlotType = PlotType.DiscontinuousLine)] public IndicatorDataSeries SMA_Drop { get; set; } //Red-Down
[Output("SMA Rise", LineColor = "#FF00843B", Thickness = 2, PlotType = PlotType.DiscontinuousLine)] public IndicatorDataSeries SMA_Rise { get; set; } //Green-UP
private Bars Series_D1, Series_m5; //Bars to load for Daily, Minute5
private RelativeStrengthIndex _rsi; //Rsi (Output 50 Up, Down)
private MovingAverage _sma; //SMA.50Hour (Output) //_hma;
private bool b_maUp, b_maDn, b_maFt, b_maKO; //Switches to Plot ma Up,Down,Flat and at the LastHistoryBar(only once)
private bool b_rsiW, b_AtSc = true; //Rsi Switch Up,Down (>=50:True, <=50:False); AutoScroll at Hour TimeFrame;
private int idx_pr1, idx_lCB, idx_lm5; //BarsIndex(m5) at OpenTime of PreClosed/LastChartBar, m5 real LastBarIndex(Let BiasTrend more sensetive within LastChartBar);
private string fmt_Decm = "0."; //Price (Decimal) Format
private DateTime dt_m5; //Recording Series_m5 LastBar OpenTime
private TimeSpan ts_bar; //Recording timespan-1min of one bar time-length of chart bar
private string s_RectGoUp, s_RectGoDn; //Rectangle Name GoUp/Down
private double db_RctMinY, db_RctMaxY; //Rectangle Y Value GoUp/Down
private DateTime dt_RsiGoUp, dt_RsiGoDn, dt_RsiFCls;//Time Rsi >50, <50, FirstClose
private double db_Ave22DaysHL; //22Day HighLow Average * % as indicator to display PriceMoved to Extreame Level, DailyHighLow
private double db_maTrdDlt; //MA's Up,Down,Flat DeltaValue, according to (setting: MA Trend Buffer ‰ and DayOpenPrice)
private ChartVerticalLine vl_MsMv; //VerticalLine when Alt+MoveMouse;
//TextBox for loading, debugging etc.;
private TextBox Tx_Load = new TextBox{ Text = "", FontSize = 20, FontFamily = "DejaVu Sans Mono", Margin = "0 0 0 10", IsReadOnly = true, BorderThickness = 0, BorderColor = Color.Transparent,
VerticalAlignment = VerticalAlignment.Bottom, HorizontalAlignment = HorizontalAlignment.Center, BackgroundColor = Color.Transparent };
private string cs_BlOtln, cs_BlFill, cs_BrOtln, cs_BrFill; //ColorString of ChartBars (Changeable)
private readonly Color cl_LdnMsg = Color.FromHex("#AAEEDDCC"), cl_HzLn = Color.FromHex("#FFFFC000"); //Color of loading message, HorizentalLine
private readonly Color cl_RsiUp = Color.FromHex("#3001AF50"), cl_RsiDn = Color.FromHex("#25FF3334"), cl_CrsnMA = Color.FromHex("#FFFFFFFF"); //BiasTrend BackgroundColor GoUp, GoDown, Bar crossing MA
private readonly Color cl_vwGrn = Color.FromHex("#8001AF50"), cl_vwRed = Color.FromHex("#80FF3334"), cl_vwGry = Color.FromHex("#55777777"); //SetViewRange marker's color, Green, Red, Grey
private readonly string icU="↗", icD="↘", chE="=", nSp=" ", nLn="\n", nSc=": "; //Icons and Characters
private readonly string pfx_GoUp = "GoUp_", pfx_GoDn = "GoDn_", pfx_HzLn = "HzLn_"; //Prefix: ID of Rectangle Go Up,Down, HorizentalLine(Price Marker)
private readonly string pfx_Opne = "Open: ", pfx_Clos = "Clse: "; //Prefix: Bar Open,Close Price;
private readonly string pfx_VtLn = "MseMve", pfx_AvHL = "A.HL: ", pfx_UDma = "ma.±: "; //Prefix: ID of VerticalLine (Ctrl+MouseMove); VerticalLine Popup message texts;
private readonly string pfx___ma = "ma ", pfx__rsi = "rsi", pfx_DtMA = "ma.Δ: "; //Prefix: VerticalLine Popup message texts;
private readonly string pfx_D1Ct = "D1.Count: ", pfx_FxSc = "FixScroll: "; //Prefix: Alt+Click D1.Count, FixScroll: True / False;
private readonly string pfx_m5Ct = "M5.Count: ", pfx_maDt = "ma.ΔT: "; //Prefix: Alt+Click M5.Count, ma.Δ Flat,Up,Down Threshold;
private readonly string fmt_SgZo = "0", fmt_s2Zo = " 00", fmt_s1Zo = " 0", fmt_s6Zo = "0.0000 00"; //Format: Decimal places for values;
private readonly string fmt_Pips = "+0.0;-0.0", fmt__rsi = "0.00"; //Format: Pips, rsi value;
private readonly string fmt_BrTm = "dd MMM HH:mm:ss", fmt_HLAv = "0.00%"; //Format: Ctrl+MouseMove Bar's DateTime; High-Low 22day Average%;
private readonly string fmt_DyWk = "ddd", fmt__Fri = "Fri", fmt__Sat = "Sat", fmt__Sun = "Sun"; //Format: SetViewRange Day of week;
private readonly string pfx_2DTp = "2Day's Top", pfx_2DMd = "2Day's Mid", pfx_2DBt = "2Day's Btm"; //Prefix: ID of MarkerLines for SetViewRange;
protected override void Initialize()
{
//1.Basic Setting for All
int iDecDigi = Convert.ToInt32(Math.Abs(Math.Log10(Symbol.PipSize))); //Digi of PipSize Decimal
for (int i = 1; i <= iDecDigi; i++) {fmt_Decm += fmt_SgZo;} //Format of Price to ChartText "0.00" "0.0000" etc.
SMA_Pd *= 12; RSI_Pd *= 12; //Convert Periods of Settings to TF.Minute5
Tx_Load.ForegroundColor = cl_LdnMsg; Chart.AddControl(Tx_Load); //Draw LoadingMessage;
//2.Get Bars of TimeFrame Day1 and Minute5, one bar's timespan
Series_D1 = MarketData.GetBars(TimeFrame.Daily); //Get TF.Day1 Bars
while ( Series_D1.Count < 30 ) { Series_D1.LoadMoreHistory(); } //TF.Day1 Bars cover at least 30 Days Data
Series_m5 = MarketData.GetBars(TimeFrame.Minute5); //Get TF.5Min Bars
while ( Series_m5.Count < 60*24*12 ) { Series_m5.LoadMoreHistory(); } //TF.5Min Bars cover at least 60 Days Data
ts_bar = Bars.OpenTimes[2]-Bars.OpenTimes[1]-TimeSpan.FromMinutes(1); //Get timespan-1min of one bar time-length of chart bar
//3.Nest Indicator Dataseries
_sma = Indicators.MovingAverage(Series_m5.ClosePrices, SMA_Pd, SMA_Type);
_rsi = Indicators.RelativeStrengthIndex(Series_m5.ClosePrices, RSI_Pd);
//4.RsiHMA Initialise Rectangle Y, X values, Plot First Rectangel
db_maTrdDlt = Series_D1.LastBar.Open * (SMA_TrBf/100000); //Get m5 TrendDeltaValue to decide ma Flat,Up or Down
DateTime ChtBrsOpn = Bars[0].OpenTime; dt_RsiFCls = Series_D1.LastBar.OpenTime.AddDays(1); //Get ChartBarsOpenTime; Initialize Rectangle's CloseTime (to avoid DrawRSIDayEndRect extend retangle at a new day start);
idx_lCB = (ChtBrsOpn < Series_m5[0].OpenTime) ? 0 : Series_m5.OpenTimes.GetIndexByTime(ChtBrsOpn); //Get m5 (Index=0 or >0) according first Chart.Bar earlier or later than m5 FirstBar;
idx_lm5 = idx_lCB; b_rsiW = (_rsi.Result[idx_lm5] >= 50); //Get m5 (Index for Checking Rsi 50 Up,Down); Set Rsi PlotSwitch to ConterSide(Make sure first Rectangle can be plot);
dt_RsiGoUp = Series_m5[idx_lCB].OpenTime; s_RectGoUp = pfx_GoUp + dt_RsiGoUp.ToString(); //Initialize RectangleID RsiGoUp
dt_RsiGoDn = Series_m5[idx_lCB].OpenTime; s_RectGoDn = pfx_GoDn + dt_RsiGoDn.ToString(); //Initialize RectangleID RsiGoDn
db_RctMinY = 0; db_RctMaxY = Bars.HighPrices.Maximum(Bars.HighPrices.Count) * 3; //Y axis Values 0 ~ 3 times of Highest Price
DrawRSIDayEndRect(); //Draw Up or Down Rect. till end of the day;
//5.Define MovingExtreame Level (22 Day High-Low average)
for (int i = 1; i <= AHL_Pd; i++) { db_Ave22DaysHL += (Series_D1.HighPrices.Last(i) - Series_D1.LowPrices.Last(i)); }
db_Ave22DaysHL /= AHL_Pd;
//6.Chart View Settings (Zoom and Y-Range);
if ( TimeFrame == TimeFrame.Minute ) {Chart.ZoomLevel = 5; Chart.ScrollXTo(Bars.OpenTimes.GetIndexByTime(Series_D1.LastBar.OpenTime.AddMinutes(44))); } //Auto-Scroll to Strength Meter's ResetPoint;
else if ( TimeFrame == TimeFrame.Minute5 ) {Chart.ZoomLevel = 20; Chart.ScrollXTo(Bars.Count); Chart.ScrollXBy(-85); } //To Stop Auto-Scrolling, let user manually drag (1Day 4Hours in Chart)
else if ( TimeFrame >= TimeFrame.Hour4 ) {Chart.ZoomLevel = 50; Chart.ScrollXTo(Bars.Count); Chart.ScrollXBy(-Convert.ToInt32(ChrtBrN/1.6)); } //To Stop Auto-Scrolling, see more history bars
else if ( TimeFrame <= TimeFrame.Hour ) {Chart.ZoomLevel = 35; } //Scroll in SetViewRange,
else if ( TimeFrame == TimeFrame.Tick1000) {Chart.ZoomLevel = 35; Chart.ScrollXTo(Bars.Count); Chart.ScrollXBy(-Convert.ToInt32(ChrtBrN/1.5)); } //To Stop Auto-Scrolling,
else if ( TimeFrame < TimeFrame.Tick1000) {Chart.ZoomLevel = 5; Chart.ScrollXTo(Bars.Count); Chart.ScrollXBy(-Convert.ToInt32(ChrtBrN*5 )); } //To Stop Auto-Scrolling;
SetViewRange(true); //Set Viewable Range in Y-value;
GetBarsColors(); //GetBarsColor according SymbolName;
//7.Reformat ToCP Dots Position
var CtTxs = Chart.FindAllObjects(ChartObjectType.Text).Where(x => x.Name.Contains(pfx_HzLn));
foreach (ChartText CtTx in CtTxs) { ChTxtCenter(CtTx); }
//8.Initialise Chart Controls, LoadingMessage
Chart.KeyDown += Chart_KeyDown; //HotKeys
Bars.BarOpened += Bars_BarOpened; //EachNewBar
Chart.MouseMove += Chart_MouseMove; //MoveMouse
Chart.MouseDown += Chart_MouseDown; //Click Chart
Chart.ZoomChanged += Chart_ZoomChanged; //Zoom Change
Chart.ScrollChanged += Chart_ScrollChanged; //Scroll Change
}
public override void Calculate(int index)
{
//1.Calculate LastBar
if (IsLastBar)
{
//Only Run when a new Series_m5 start
if (Series_m5.LastBar.OpenTime <= dt_m5 && b_maKO) return; //FirstRun dt_m5 is 0, and updated only in MAlastBars
MAlastBars(index); //Plot MA Last Bars
DrawRSIBackground(index, true); //Plot RSI New Bias Trend
CrossingMA(index); //Plot Signal BarCrossingMA
}
//2.Calculate History Bars
else
{
MApastBars(index); //Plot MA History Bars
DrawRSIBackground(index, false); //Plot RSI History Bias Trend
FillClosedBar(index); //Plot Signal History BarCrossedMA
}
}
//Plot MA - Last Bars
private void MAlastBars(int idx)
{
if ( Math.Abs(_sma.Result.Last(0) - _sma.Result.Last(1)) < db_maTrdDlt) {b_maUp = false; b_maDn = false; b_maFt = true ; } //ma Flat
else if (_sma.Result.IsRising ()) {b_maUp = true ; b_maDn = false; b_maFt = false; } //ma Up
else if (_sma.Result.IsFalling()) {b_maUp = false; b_maDn = true ; b_maFt = false; } //ma Down
//Plot _sma to Flat-Rise-Drop in different colors
SMA_Move[idx] = _sma.Result.LastValue;
if (b_maUp) SMA_Rise[idx] = _sma.Result.LastValue;
if (b_maDn) SMA_Drop[idx] = _sma.Result.LastValue;
//Update Series_m5 LastBar OpenTime
dt_m5 = Series_m5.LastBar.OpenTime;
//Turn On after [LastHistoryBar] updated (Run OnlyOnce, Don't merge MAlastBars with MApastBars)
if (!b_maKO) b_maKO = true;
}
// - History Bars
private void MApastBars(int idx)
{
//Prepare indices for Series_m5
idx_lCB = Series_m5.OpenTimes.GetIndexByTime(Bars.OpenTimes[idx ]); //Get m5 index at OpenTime of LastChartBar
idx_pr1 = Series_m5.OpenTimes.GetIndexByTime(Bars.OpenTimes[idx - 1]); //Don't use idx_lCB - 1;
if ( idx_lCB < 0 || idx_pr1 < 0 ) return; //To avoid crashing at sma.Result[<0];
if ( Math.Abs(_sma.Result[idx_lCB] - _sma.Result[idx_lCB-1]) < db_maTrdDlt) {b_maUp = false; b_maDn = false; b_maFt = true ; } //ma Flat
else if (_sma.Result[idx_lCB]>_sma.Result[idx_pr1]) {b_maUp = true ; b_maDn = false; b_maFt = false; } //ma Up
else if (_sma.Result[idx_lCB]<_sma.Result[idx_pr1]) {b_maUp = false; b_maDn = true ; b_maFt = false; } //ma Down
//Plot _sma to Flat-Rise-Drop in different colors
SMA_Move[idx] = _sma.Result[idx_lCB];
if (b_maUp) SMA_Rise[idx] = _sma.Result[idx_lCB];
if (b_maDn) SMA_Drop[idx] = _sma.Result[idx_lCB];
}
//Plot RSI.Trend- Background (Rectangles)
private void DrawRSIBackground(int idx, bool b_LastBr)
{
idx_lCB = Series_m5.OpenTimes.GetIndexByTime(Bars.OpenTimes[idx]+ts_bar); //Get the last m5 index at OpenTime of LastChartBar
idx_lm5 = b_LastBr ? Series_m5.Count - 1 : idx_lCB; //LastBar use index of m5.Last(0);
DrawRSIUpDownRect(); //Draw Rectangle
}
//Draw Up or Down Rect. till end of the day
private void DrawRSIDayEndRect()
{
DateTime dt_RectEnd = Series_D1.LastBar.OpenTime.AddDays(1); //Get Time of DayEnd
if (dt_RectEnd >= dt_RsiFCls) //Check if a new day start, (must be >=, T80 need it to display background)
{
dt_RsiFCls = dt_RectEnd; //Update RectangleCloseTime till end of day;
if (b_rsiW) {DrawRsiRect(s_RectGoUp, dt_RsiGoUp, dt_RsiFCls, cl_RsiUp );} //Extend current BiasTrend - UP
else {DrawRsiRect(s_RectGoDn, dt_RsiGoDn, dt_RsiFCls, cl_RsiDn );} //... - Down
}
DrawRSIUpDownRect(); //Draw Rectangle
}
//Draw Up or Down Rect. as PreDefined DateTime
private void DrawRSIUpDownRect()
{
//Get Rsi UP TurningTime, Record TimeOfTurning, Name of Plotting ; Plot Previous, Next Background Rectangle (Green)
if ( ( (_rsi.Result[idx_lm5] >= 50 && b_maFt) || (_rsi.Result[idx_lm5] >= 50-RSI_Bf && b_maUp) || (_rsi.Result[idx_lm5] >= 50+RSI_Bf && b_maDn) ) && !b_rsiW ) //ma filter rsi noise: Flat-50; Up,Down: 50±BufferValue
{ // ↓↓↓ Make one bar ahead of rsi switch up/down (v4.11)
dt_RsiGoUp = Series_m5[idx_lCB].OpenTime-ts_bar; s_RectGoUp = pfx_GoUp + dt_RsiGoUp.ToString(); b_rsiW = true ;
DrawRsiRect(s_RectGoDn, dt_RsiGoDn, dt_RsiGoUp, cl_RsiDn ); //Close Pre.Down Trend Background Rectangle
DrawRsiRect(s_RectGoUp, dt_RsiGoUp, dt_RsiFCls, cl_RsiUp ); //Draw Next UP Trend Background Rectangle
}
//Get Rsi DOWN TurningTime, Record TimeOfTurning, Name of Plotting ; Plot Previous, Next Background Rectangle (Red)
if ( ( (_rsi.Result[idx_lm5] <= 50 && b_maFt) || (_rsi.Result[idx_lm5] <= 50+RSI_Bf && b_maDn) || (_rsi.Result[idx_lm5] <= 50-RSI_Bf && b_maUp) ) && b_rsiW ) //ma filter rsi noise: Flat-50; Down,Up: 50±BufferValue
{ // ↓↓↓ Make one bar ahead of rsi switch up/down (v4.11)
dt_RsiGoDn = Series_m5[idx_lCB].OpenTime-ts_bar; s_RectGoDn = pfx_GoDn + dt_RsiGoDn.ToString(); b_rsiW = false;
DrawRsiRect(s_RectGoUp, dt_RsiGoUp, dt_RsiGoDn, cl_RsiUp ); //Close Pre.Up Trend Background Rectangle
DrawRsiRect(s_RectGoDn, dt_RsiGoDn, dt_RsiFCls, cl_RsiDn ); //Draw Next Down Trend Background Rectangle
}
}
//Draw a Rectangle for RSI Background
private void DrawRsiRect(string recName, DateTime dtStart, DateTime dtEnd, Color clrToFill)
{ ChartRectangle rectangle = Chart.DrawRectangle(recName, dtStart, db_RctMinY, dtEnd, db_RctMaxY, clrToFill, 0, LineStyle.DotsVeryRare); rectangle.IsFilled = true; }
//Plot Signals for crossing MA, or restore ChartBar's color
private void CrossingMA(int idx)
{
//Plot LastBar's FillColor
if ( ( Bars[idx].Close >= SMA_Move[idx] && Bars[idx-1].Close < SMA_Move[idx-1] ) & b_rsiW || //Crossing UP MA
( Bars[idx].Close <= SMA_Move[idx] && Bars[idx-1].Close > SMA_Move[idx-1] ) & !b_rsiW || //Crossing Down MA
( Bars[idx].Close >= SMA_Move[idx] && Bars[idx ].Open < SMA_Move[idx ] ) & b_rsiW || //Crossing UP MA
( Bars[idx].Close <= SMA_Move[idx] && Bars[idx ].Open > SMA_Move[idx ] ) & !b_rsiW ) //Crossing Down MA
{ Chart.SetBarFillColor(idx, cl_CrsnMA); }
}
//Plot Signals for Bar crossed MA
private void FillClosedBar(int idx)
{
//Plot ClosedBar's FillColor
if ( ( Bars[idx].Close >= SMA_Move[idx] && Bars[idx-1].Close < SMA_Move[idx-1] ) & b_rsiW || //Crossing UP MA
( Bars[idx].Close <= SMA_Move[idx] && Bars[idx-1].Close > SMA_Move[idx-1] ) & !b_rsiW || //Crossing Down MA
( Bars[idx].Close >= SMA_Move[idx] && Bars[idx ].Open < SMA_Move[idx ] ) & b_rsiW || //Crossing UP MA
( Bars[idx].Close <= SMA_Move[idx] && Bars[idx ].Open > SMA_Move[idx ] ) & !b_rsiW ) //Crossing Down MA
{ Chart.SetBarFillColor(idx, cl_CrsnMA); }
else if (Bars[idx].Close >= Bars[idx].Open ) { Chart.SetBarFillColor(idx, cs_BlFill); }
else if (Bars[idx].Close <= Bars[idx].Open ) { Chart.SetBarFillColor(idx, cs_BrFill); }
}
//ChartControl - NewBar to Plot MA, Rsi background
private void Bars_BarOpened(BarOpenedEventArgs obj)
{
int i = obj.Bars.Count-1; //ChartBarIndex; (Count-1: the LastBar)
MAlastBars(i ); //Plot ma Last Bars (Working for TF<Minute5 e.g. Tick80)
FillClosedBar(i-1); //Refresh Signal BarCrossedMA (Count-2: the PreviousBar)
DrawRSIDayEndRect(); //Refresh Up or Down Rect. till end of the day
SetViewRange(false); //Plot 2Days HighLow Moving Marker, not reset Y-Range;
}
// - MoveMouse
private void Chart_MouseMove(ChartMouseEventArgs obj)
{
if ( obj.CtrlKey )
{
int r = Convert.ToInt32(obj.BarIndex); if (r>Bars.Count-1) return; //Get MouseMoveBarIndex
vl_MsMv = Chart.DrawVerticalLine(pfx_VtLn, r, Color.FromArgb(150, cl_LdnMsg), 1, LineStyle.Dots); //Draw a verticalline
int i = Series_m5.OpenTimes.GetIndexByTime(Bars.OpenTimes[r ]+ts_bar); //Get LastBar index of Series_m5 MouseMoveIn ChartBar
i = r < Bars.Count-1 ? i : Series_m5.Count - 1; //... index (History or LastBar)
int j = Series_m5.OpenTimes.GetIndexByTime(Bars.OpenTimes[r-1]+ts_bar); //Get LastBar index of Series_m5 Previous ChartBar
double BrOpn = Bars[r].Open, BrCls = Bars[r].Close; //Get Symbols' Open/Close Price at [r]
string fmtMa = fmt_Decm + (BrCls<200 ? fmt_s2Zo : fmt_s1Zo); //Define MA's format (at ma LastResult " 00", " 0")
string sBrOp = BrOpn.ToString(fmtMa), BrCl = BrCls.ToString(fmtMa); //Get Bar[r]'s Open/Close Price Format ready
string ma_Mve = _sma.Result[i]>_sma.Result[j] ? icU : _sma.Result[i]<_sma.Result[j] ? icD : chE; //Get MA 's move direction ↗↘= (against ma Result at PreviousChartBarOpenTime)
string rsiMve = _rsi.Result[i]>_rsi.Result[j] ? icU : _rsi.Result[i]<_rsi.Result[j] ? icD : chE; //Get RSI's move direction ↗↘= (against ma Result at PreviousChartBarOpenTime)
string ma_Val = _sma.Result[i].ToString(fmtMa); //Get MA 's Value
string ma_Dlt = Math.Abs( _sma.Result[i ] - _sma.Result[i-1]).ToString(fmt_s6Zo); //Get MA 's DeltaValue (against ma PreviousResult "0.0000 00")
string ma_Gap = ((BrCls - _sma.Result[i])/Symbol.PipSize).ToString(fmt_Pips); //Get MA 's Gap in (pips "0.0")
string rsiVal = _rsi.Result[i].ToString(fmt__rsi); //Get RSI's Value (at rsi LastResult "0.00")
string BarTme = Bars[r].OpenTime.Add(Application.UserTimeOffset).ToString(fmt_BrTm); //Get ChartBar's OpenTime "dd MMM HH:mm:ss"
double db_Ave22PresHL = 0; int iD1 = Series_D1.OpenTimes.GetIndexByTime(Bars.OpenTimes[r ]); //Get 22 Days' Average High-Low : Series_D1 index of MouseMoveIn
for (int k=1; k<=AHL_Pd; k++) { db_Ave22PresHL += (Series_D1[iD1-k].High - Series_D1[iD1-k].Low); } //... : H-L Total of setting period (Days)
string HL22Dy = (db_Ave22PresHL/AHL_Pd).ToString(fmt_Decm); //... : H-L Average
string Pc22Dy = ((db_Ave22PresHL/AHL_Pd)/Series_D1.LastBar.Open).ToString(fmt_HLAv); //Get 22 Days' Average H-L % of DayOpenPrice "0.00%"
Tx_Load.Text = RChr(BarTme, 17) + pfx_AvHL + Pc22Dy +nSp+ HL22Dy +nLn; //Popup: 14 Jun 21:00:00 AH-L: 0.89% 0.0095
Tx_Load.Text += RChr(pfx_Opne + sBrOp , 17) + pfx_Clos + BrCl +nLn; //Popup: Open: 1.26705 Clse: 1.2685
Tx_Load.Text += RChr(pfx___ma+ma_Mve+nSc+ma_Val, 17) + pfx_UDma+ ma_Gap +nLn; //Popup: ma ↗: 1.26789 ma.d: -32.2
Tx_Load.Text += RChr(pfx__rsi+rsiMve+nSc+rsiVal, 17) + pfx_DtMA+ ma_Dlt ; //Popup: rsi↗: 50.1234 ma.Δ: 0.0000 08
}
}
// - ClickMouse
private void Chart_MouseDown(ChartMouseEventArgs obj)
{
Tx_Load.Text = string.Empty; //Clear Loading Message
if ( vl_MsMv != null ) { Chart.RemoveObject(vl_MsMv.Name); } //Remove MouseMove VerticalLine
if ( obj.AltKey )
{
b_AtSc = !b_AtSc; //TF.Hour AutoScroll Switch;
Tx_Load.Text = RChr(pfx_D1Ct+ Series_D1.Count, 17) +pfx_FxSc+ b_AtSc.ToString() +nLn; //Popup: Bars.Count "D1.Count: {0} FixScroll: {1}\n"
Tx_Load.Text += RChr(pfx_m5Ct+ Series_m5.Count, 17) +pfx_maDt+ db_maTrdDlt.ToString(fmt_s6Zo); //Popup: m5 moving trend delta value "M5.Count: {0} ma.ΔT: {1}" "0.0000 00"
}
}
// - Zoom Change
private void Chart_ZoomChanged (ChartZoomEventArgs obj)
{ SetViewRange(true); }
// - Scroll Change
private void Chart_ScrollChanged(ChartScrollEventArgs obj)
{ SetViewRange(FixScrl); }
// - KeyDown
private void Chart_KeyDown(ChartKeyboardEventArgs obj)
{
if (obj.AltKey)
{
//Alt+H: Mark a TrendLine for today
if (obj.Key.Equals(Key.H )) { DrawDayPriceLevel(); }
//Alt+R: Remove TrendLine for previous and today
if (obj.Key.Equals(Key.R )) { RemoveDayPrcLevel(1); }
//Alt+E: Remove all TrendLines
if (obj.Key.Equals(Key.E )) { RemoveDayPrcLevel(999); }
//Alt+8: Set Chart TimeFrame to 80Ticks
if (obj.Key.Equals(Key.D8)) { Chart.TryChangeTimeFrame(TimeFrame.Tick80); }
//Alt+9: Set Chart TimeFrame to Minute5
if (obj.Key.Equals(Key.D9)) { Chart.TryChangeTimeFrame(TimeFrame.Minute5);}
//Alt+0: Set Chart TimeFrame to 1Hour
if (obj.Key.Equals(Key.D0)) { Chart.TryChangeTimeFrame(TimeFrame.Hour); }
//Alt+B: debug
if (obj.Key.Equals(Key.B ))
{
//string msg = Series_D1.OpenTimes.Last(0).ToString();
//Chart.DrawStaticText("Debug",msg,VerticalAlignment.Center,HorizontalAlignment.Center,Color.Wheat);
}
}
//ESC: to remove Trendline of today
if ( obj.Key.Equals(Key.Escape) ) { RemoveDayPrcLevel(0); }
}
//Draw Trendline at current price level
private void DrawDayPriceLevel()
{
//Remove Today's TrendLine and Dot
RemoveDayPrcLevel(0);
//Draw Today's TrendLine and Dot
DateTime dT1 = Series_D1.OpenTimes.Last(0), dT2 = Series_D1.OpenTimes.Last(0).AddHours(24);
ChartTrendLine TdLn = Chart.DrawTrendLine( pfx_HzLn+dT1.ToString("yyyy-MM-dd"), dT1, Bars.LastBar.Close, dT2, Bars.LastBar.Close, cl_HzLn, 1, LineStyle.LinesDots );
TdLn.IsInteractive = true; TdLn.IsLocked = true;
ChartText ChTx = Chart.DrawText( pfx_HzLn+"⬩"+dT1.ToString("yyyy-MM-dd"), "⬩", Server.Time, Bars.LastBar.Close, cl_HzLn );
ChTx.IsInteractive = true; ChTx.IsLocked = true; ChTxtCenter(ChTx);
}
//Set ChartText Horizontal,Vertical Center
private void ChTxtCenter(ChartText tx_cnt)
{ tx_cnt.VerticalAlignment = VerticalAlignment.Center; tx_cnt.HorizontalAlignment = HorizontalAlignment.Center; tx_cnt.FontSize = 20; }
//Remove trendlines (i_D: 0 remove today, 1 remove previous and today, 999 remove all before 2 days ago)
private void RemoveDayPrcLevel(int i_D)
{
if ( i_D<=1 )
{
var TrLns = Chart.FindAllObjects(ChartObjectType.TrendLine).Where( x => x.Name.Contains(pfx_HzLn) );
foreach (ChartTrendLine TrLn in TrLns) { if ( DateTime.Compare(TrLn.Time1, Series_D1.OpenTimes.Last(i_D))>=0 ) { Chart.RemoveObject(TrLn.Name); Chart.RemoveObject(TrLn.Name+"⬩"); } }
}
else if ( i_D==999 )
{
var TrLns = Chart.FindAllObjects(ChartObjectType.TrendLine).Where( x => x.Name.Contains(pfx_HzLn) );
foreach (ChartTrendLine TrLn in TrLns) { if ( DateTime.Compare(TrLn.Time1, Series_D1.OpenTimes.Last( 1 ))< 0 ) { Chart.RemoveObject(TrLn.Name); Chart.RemoveObject(TrLn.Name+"⬩"); } }
}
}
//Set Viewable Range in Y-value VRFactr% * Ave22DaysHigh-Low
private void SetViewRange(bool b_ResetY)
{
if (VRFactr > 0 && (TimeFrame <= TimeFrame.Tick1000 || TimeFrame <= TimeFrame.Hour)) //Only Display VRFactr>0 and in right TF
{
//Get Mid-Level of Past2Day's High-Low Level
double db_Pst2DyHgh = Math.Max(Series_D1.HighPrices.Last(1), Series_D1.HighPrices.Last(0)); //2Days' High
double db_Pst2DyLow = Math.Min(Series_D1.LowPrices.Last(1) , Series_D1.LowPrices.Last(0) ); //2Days' Low
double db_Ymid = (db_Pst2DyHgh + db_Pst2DyLow)/2; //2Days' Mid
//Get Bottom and Top value for view range
double db_zmot = 100;
if (TimeFrame <= TimeFrame.Tick80 && Chart.ZoomLevel >= 10) {db_zmot = 200;} //ZoomOut 200%, TF.Tick80 or shorter and ChartZoom>=10%
double db_Ybtm = db_Ymid - db_Ave22DaysHL * VRFactr/db_zmot;
double db_Ytop = db_Ymid + db_Ave22DaysHL * VRFactr/db_zmot;
//Get Recent 2 TradingDays Start-End
DateTime Sv_DSpl = Series_D1.LastBar.OpenTime; //ServerTime of Spliting TradingDay(DST:+3) on User's Chart
int i_H, i_R; string st_DSpl = Sv_DSpl.ToString(fmt_DyWk); //Swifting Days Number, ChartHours; and Day of SplitingMoment "ddd"
if (st_DSpl == fmt__Fri) { i_H = -1; i_R = +3; } //"Fri"
else if (st_DSpl == fmt__Sat) { i_H = -2; i_R = +2; } //"Sat"
else if (st_DSpl == fmt__Sun) { i_H = -3; i_R = +1; } //"Sun"
else { i_H = -1; i_R = +1; } //Other Weekday
DateTime dt_2DSt = Sv_DSpl.AddDays(i_H); DateTime dt_2DEd = Sv_DSpl.AddDays(i_R); //HorizentalLine Start, End DateTime
//Draw a BenchMarker(HorizentalLine)
Color clr_2Dhl = cl_vwGry; //Long TimeFrame use: Grey only
if (TimeFrame <= TimeFrame.Tick80 && Chart.ZoomLevel >= 10) { clr_2Dhl = b_rsiW ? cl_vwGrn : cl_vwRed; } //ShortTimeFrame use: Green, Red (ChartZoom>=10%)
ChartTrendLine tr_2DTop = Chart.DrawTrendLine(pfx_2DTp, dt_2DSt, db_Ytop, dt_2DEd, db_Ytop, clr_2Dhl, 1, LineStyle.LinesDots);
ChartTrendLine tr_2DMid = Chart.DrawTrendLine(pfx_2DMd, dt_2DSt, db_Ymid, dt_2DEd, db_Ymid, clr_2Dhl, 2, LineStyle.Solid );
ChartTrendLine tr_2DBtm = Chart.DrawTrendLine(pfx_2DBt, dt_2DSt, db_Ybtm, dt_2DEd, db_Ybtm, clr_2Dhl, 1, LineStyle.LinesDots);
//Fix or Set View Range (both X, Y axis)
double db_Yshift = (Bars.LastBar.Close - db_Ymid) * 0.618; //Define Vertical Shift value,
if (b_ResetY) { Chart.SetYRange(db_Ybtm + db_Yshift, db_Ytop + db_Yshift); } //AutoShift Vertical to make sure ClosePrice in sight;
if (TimeFrame == TimeFrame.Hour && b_AtSc) { Chart.ScrollXTo(Bars.OpenTimes.GetIndexByTime(Sv_DSpl)-ChrtBrN+24); } //AutoShift Horizental to make sure Hour1 Bars in sight;
}
}
//Set Bars Color for all symbols
private void GetBarsColors()
{
string Smb = Symbol.Name;
if (Smb == "EURUSD" || Smb == "EURGBP" || Smb == "EURAUD" || Smb == "EURNZD" || Smb == "EURCAD" || Smb == "EURCHF" || Smb == "EURJPY") { cs_BlOtln = "FF0070C0"; cs_BlFill = BlFCl(Smb); cs_BrOtln = "FF0070C0"; cs_BrFill = "FF0070C0"; }
else if (Smb == "GBPUSD" || Smb == "GBPAUD" || Smb == "GBPNZD" || Smb == "GBPCAD" || Smb == "GBPCHF" || Smb == "GBPJPY") { cs_BlOtln = "FFFE0000"; cs_BlFill = BlFCl(Smb); cs_BrOtln = "FFFE0000"; cs_BrFill = "FFFE0000"; }
else if (Smb == "AUDUSD" || Smb == "AUDNZD" || Smb == "AUDCAD" || Smb == "AUDCHF" || Smb == "AUDJPY") { cs_BlOtln = "FFBF9100"; cs_BlFill = BlFCl(Smb); cs_BrOtln = "FFBF9100"; cs_BrFill = "FFBF9100"; }
else if (Smb == "NZDUSD" || Smb == "NZDCAD" || Smb == "NZDCHF" || Smb == "NZDJPY") { cs_BlOtln = "FF00843B"; cs_BlFill = "00000000"; cs_BrOtln = "FF00843B"; cs_BrFill = "FF00843B"; }
else if ( Smb == "USDCAD" || Smb == "CADCHF" || Smb == "CADJPY") { cs_BlOtln = "FFC341C8"; cs_BlFill = "00000000"; cs_BrOtln = "FFC341C8"; cs_BrFill = "FFC341C8"; }
else if ( Smb == "USDCHF" || Smb == "USDJPY") { cs_BlOtln = "FF99AAEE"; cs_BlFill = "FF99AADD"; cs_BrOtln = "FFFF3334"; cs_BrFill = "FFFE0000"; }
else if ( Smb == "CHFJPY") { cs_BlOtln = "FFFF999A"; cs_BlFill = "00000000"; cs_BrOtln = "FFFF999A"; cs_BrFill = "FFFF999A"; }
else if (Smb == "XAUUSD" ) { cs_BlOtln = "FFFFFF01"; cs_BlFill = "00000000"; cs_BrOtln = "FFFFFF01"; cs_BrFill = "FFFFFF01"; }
else if (Smb == "XTIUSD" || Smb.Contains("USOil") || Smb.Contains("UKOil") ) { cs_BlOtln = "FF737373"; cs_BlFill = "00000000"; cs_BrOtln = "FF737373"; cs_BrFill = "FF737373"; }
else if (Smb.Contains("US30") || Smb.Contains("UT100") || Smb.Contains("USTEC") || Smb.Contains("US500") || Smb.Contains("US2000") ||
Smb.Contains("UK100")|| Smb.Contains("DE40") || Smb.Contains("JP225") ) { cs_BlOtln = "FF0070C0"; cs_BlFill = "00000000"; cs_BrOtln = "FF0070C0"; cs_BrFill = "FF0070C0"; }
else if (Smb == "USDCNH" ) { cs_BlOtln = "FFBBBB01"; cs_BlFill = "00000000"; cs_BrOtln = "FFFE0000"; cs_BrFill = "FFFE0000"; }
else { cs_BlOtln = "FF00843B"; cs_BlFill = "FF00843B"; cs_BrOtln = "FFF15923"; cs_BrFill = "FFF15923"; }
Chart.ColorSettings.BullOutlineColor = Color.FromHex(cs_BlOtln); Chart.ColorSettings.BullFillColor = Color.FromHex(cs_BlFill); //Bullish Bars
Chart.ColorSettings.BearOutlineColor = Color.FromHex(cs_BrOtln); Chart.ColorSettings.BearFillColor = Color.FromHex(cs_BrFill); //Bearish Bars
}
//Return ColorCode according to SymbolName
private string BlFCl(string s_smb)
{
if ( s_smb == "EURAUD" || s_smb == "GBPAUD" ) {return "FFBF9100";}
else if ( s_smb == "EURNZD" || s_smb == "GBPNZD" ) {return "FF00843B";}
else if ( s_smb == "AUDNZD" ) {return "FF00843B";}
else {return "00000000";}
}
//Left -Add Spaces to a string till appointed number
private string LChr(string s_Ipt, int i_Chr)
{ if ( s_Ipt.Length < i_Chr ) { while ( s_Ipt.Length < i_Chr ) { s_Ipt = nSp + s_Ipt; } } return s_Ipt; }
//Right-Add Spaces to a string till appointed number
private string RChr(string s_Ipt, int i_Chr)
{ if ( s_Ipt.Length < i_Chr ) { while ( s_Ipt.Length < i_Chr ) { s_Ipt = s_Ipt + nSp; } } return s_Ipt; }
}
}
Capt.Z-Fort.Builder
Joined on 03.06.2020
- Distribution: Free
- Language: C#
- Trading platform: cTrader Automate
- File name: Super MA.algo
- Rating: 5
- Installs: 1786
- Modified: 26/06/2023 10:19

Comments
The update to version 4.12, brings new functions and is a major update.
With only a few steps on this site called strengths and weaknesses of quantitative research. And voilà, my assignment will be completed on time. I'm so delighted I came here!
The update to version 4.13 is a minor update, which adds more symbol codes to Oil and Equities, mainly from Varianse and ICMarkets;