Description
[Renko] Weis & Wyckoff System showcases the concepts of David H. Weis and Richard Wyckoff on Renko Chart
Last Update -> 12/12/2024
Previous Downloads: 2905+
What's new in v2.0?
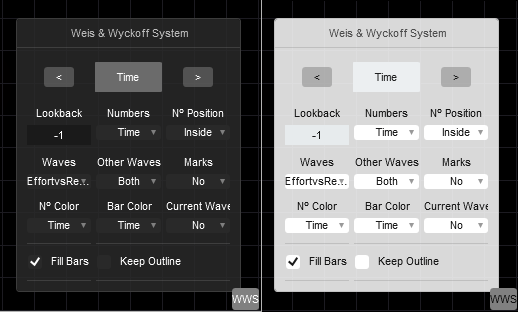
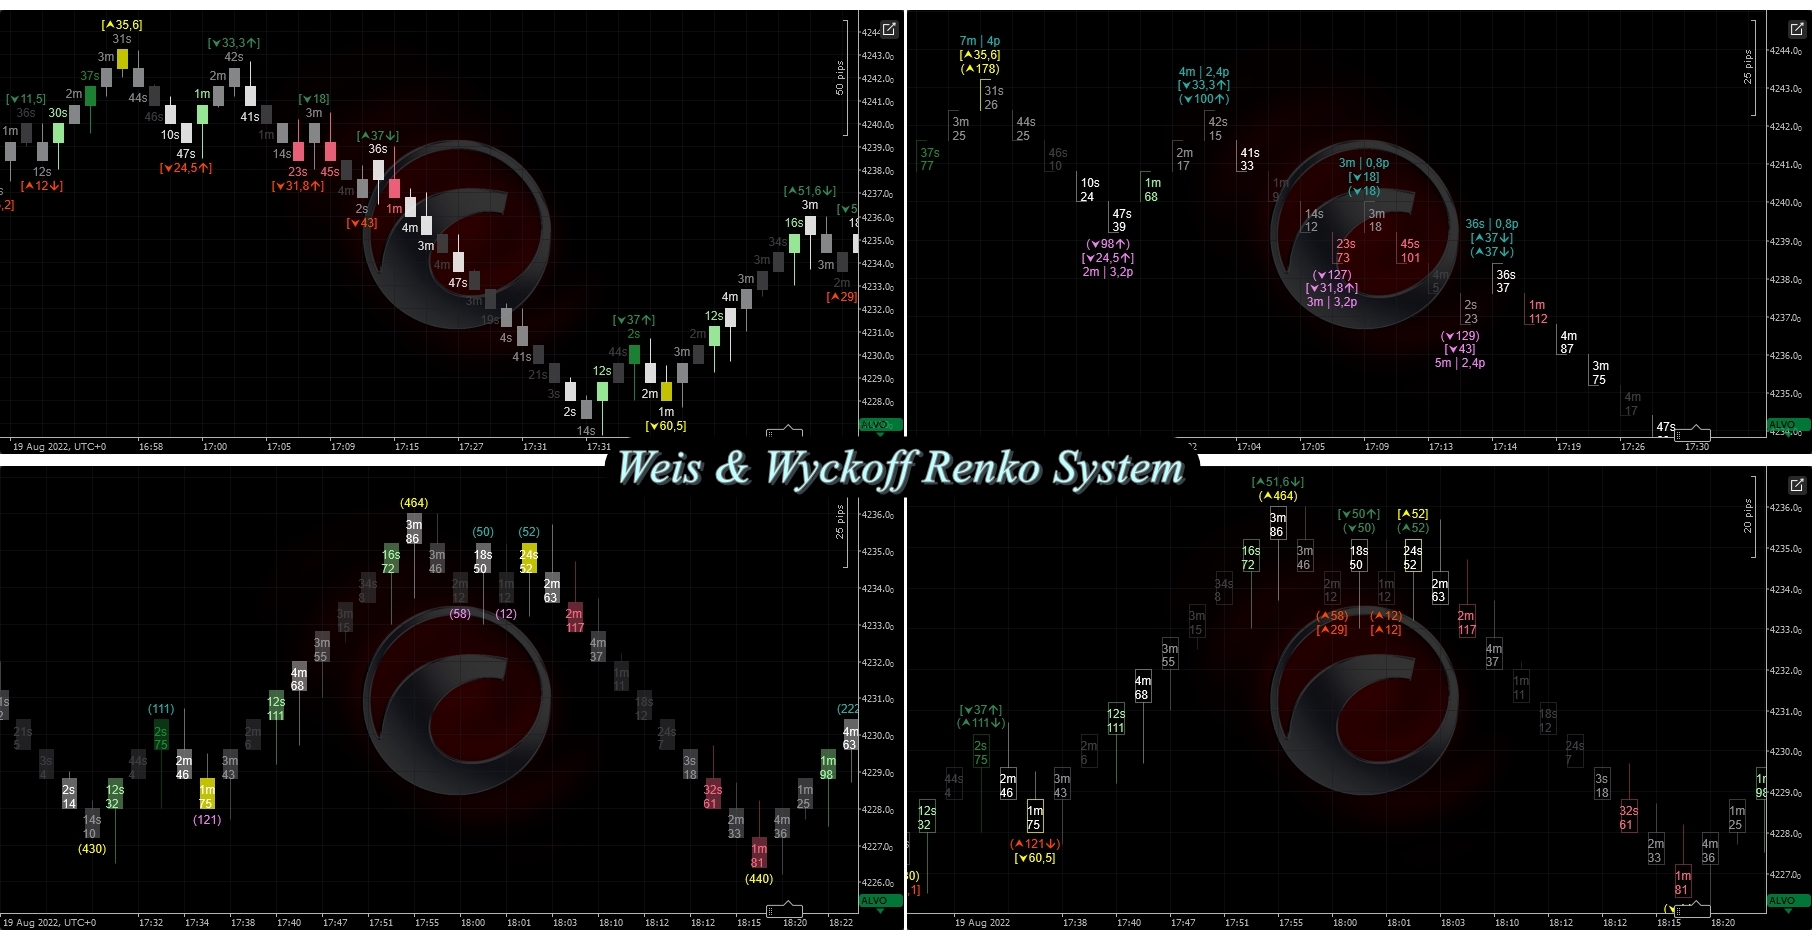
- Added Params Panel with 4 layouts templates (Insider, Time, Volume, BigBrain) for quickly switch between settings as well as more user-friendly.
- Refactor to only use Colors API
- Should work with Mac OS users.
- .NET 6.0+ is Required
===================================================
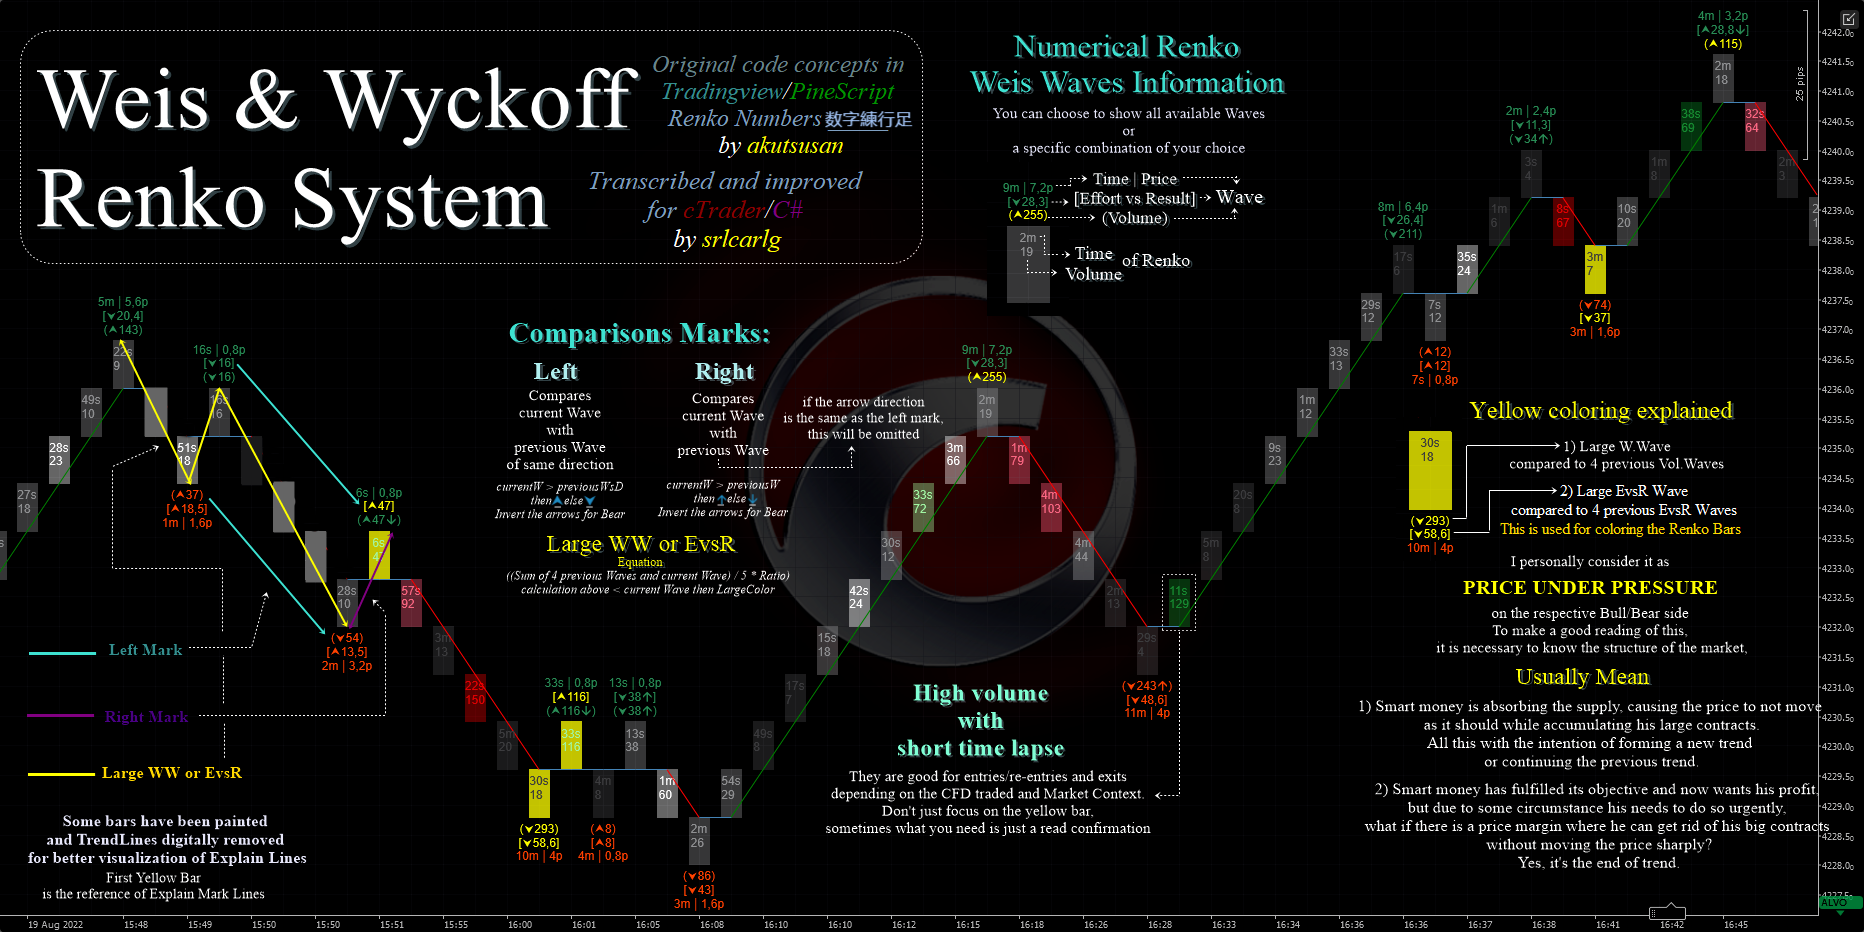
It's just a way of visualizing the Waves and Volume numerically, it's not an original idea.
You can find this way of visualization first at (David Weis on Wyckoff | Support/Resistance | and Waves, most recent Weis on Wyckoff Renko Charts - Linda Raschke)
This uses the code concepts of (Numbers-Renko 数字練行足 in PineScript),
Cheers to the akutsusho!.
I improved it and brought it to cTrader/C#... and it's Free also open-source.
I added many other features based on the original design and my personal taste, like:
- Make your favorite design template yourself: 14 design/info parameters with a total of 32 sub-options
- Non-Repaint and Repaint Weis Waves Option: You can choose whether to see the Current Trend Wave value.
- Dynamic TimeLapse: Time Waves showed the difference in milliseconds, seconds, minutes, hours, days!
- And Many Others...
==================================================
Transcribed & Improved for cTrader/C#
by srlcarlg
Original Code Concepts in TradingView/Pinescript
by akutsusho
==================================================
=== UPDATE ===
12/12/2024 - Version 2.0
16/11/2022 - Optimization in Renko Wicks code.
29/09/2022 - Added "Nº Bars to Show", userful when you don't want to calculate all the history available in the chart, which speeds up the final result.
23/08/2022 - Now you can see Renko's Current Time during his Formation when the price is updated
Redundant code removed from "Custom Load From" which generated error in previous version of cTrader (v4.0 or 4.1), the functionality still works.
To see the images clearly, right click inside the image and open in new tab
=== References: ===
I couldn't have done this so quickly if it weren't for the contribution to the cTrader Community by these People/Indicators:
Wyckoff Component:
I had done it before (Volume for Renko/Range and Renko Wicks)
Weis Waves Component:
(Swing Gann by TraderExperto) helped a lot in the structure to calculation Waves
(ZigZag by mike.ourednik) shortened the Waves Vital Code
Visit the TraderExperto Community: https://t.me/ComunidadeCtrader <<-- Grupo CTrader em Português
Anyway, cTrader needs more powerful and free custom indicators to be used by more people than other trading platforms.
/*
--------------------------------------------------------------------------------------------------------------------------------
[Renko] Weis & Wyckoff System v2.0
showcases the concepts of David H. Weis and Richard Wyckoff on Renko Chart
It's just a way of visualizing the Waves and Volume numerically, it's not an original idea.
You can find this way of visualization first at
(www.youtube.com/watch?v=uzISUr1itWg, most recent www.vimeo.com/394541866)
This uses the code concepts of (Numbers-Renko 数字練行足 https://www.tradingview.com/script/9BKOIhdl-Numbers-Renko/ in PineScript),
Cheers to the akutsusho!.
I IMPROVED IT and BROUGHT IT to cTrader/C#.
I added many other features based on the original design and my personal taste, like:
(Make your favorite design template yourself): 14 design parameters with a total of 32 sub-options
(Non-Repaint and Repaint Weis Waves Option): You can choose whether to see the Current Trend Wave value.
(Dynamic TimeLapse): Time Waves showed the difference in milliseconds, seconds, minutes, hours, days!
And many others...
.NET 6.0+ is Required
What's new in v2.0?
-Added Params Panel with 4 layouts templates (Insider, Time, Volume, BigBrain) for quickly switch between settings as well as more user-friendly.
-Refactor to only use Colors API.
-Should work with Mac OS users.
Performance Tips!
- Set lookback to 50+ (bars) or more if switching settings is taking too long
=========================================================================
Transcribed & Improved for cTrader/C#
by srlcarlg
Original Code Concepts in TradingView/Pinescript
by akutsusho
=========================================================================
"Talk is cheap. Show me the code."
Linus Torvalds
== DON"T BE an ASSHOLE SELLING this FREE and OPEN-SOURCE indicator ==
----------------------------------------------------------------------------------------------------------------------------
*/
using System;
using System.Globalization;
using System.Collections.Generic;
using System.Linq;
using cAlgo.API;
using cAlgo.API.Indicators;
using cAlgo.API.Internals;
using static cAlgo.WeisWyckoffSystemV20;
namespace cAlgo
{
[Indicator(IsOverlay = true, AutoRescale = true, AccessRights = AccessRights.None)]
public class WeisWyckoffSystemV20 : Indicator
{
public enum LoadFromData
{
Today,
Yesterday,
One_Week,
Two_Week,
Monthly,
Custom
}
[Parameter("Load From:", DefaultValue = LoadFromData.Today, Group = "==== Tick Volume Settings ====")]
public LoadFromData LoadFromInput { get; set; }
[Parameter("Custom (dd/mm/yyyy):", DefaultValue = "00/00/0000", Group = "==== Tick Volume Settings ====")]
public string StringDate { get; set; }
public enum PanelAlignData
{
Top_Left,
Top_Center,
Top_Right,
Center_Left,
Center_Right,
Bottom_Left,
Bottom_Center,
Bottom_Right,
}
[Parameter("Panel Position:", DefaultValue = PanelAlignData.Bottom_Right, Group = "==== [Renko] Weis & Wyckoff System v2.0 ====")]
public PanelAlignData PanelAlignInput { get; set; }
[Parameter("Show Wicks?", DefaultValue = false, Group = "==== [Renko] Weis & Wyckoff System v2.0 ====")]
public bool ShowWicks { get; set; }
[Parameter("Wicks Thickness:", DefaultValue = 1, MaxValue = 5, Group = "==== [Renko] Weis & Wyckoff System v2.0 ====")]
public int Thickness { get; set; }
public enum NumbersBothPositionData
{
Default,
Invert,
}
[Parameter("[Both] Inside Numbers Position:", DefaultValue = NumbersBothPositionData.Default, Group = "==== Numerical Renko Bars ====")]
public NumbersBothPositionData NumbersBothPositionInput { get; set; }
[Parameter("Show Only Large Numbers:", DefaultValue = false, Group = "==== Numerical Renko Bars ====")]
public bool ShowOnlyLargeBool { get; set; }
public enum DigitsToView
{
All,
_4_Digits,
_3_Digits,
}
[Parameter("Volume Digits View:", DefaultValue = DigitsToView.All, Group = "==== Numerical Renko Bars ====")]
public DigitsToView DigitsToViewInput { get; set; }
[Parameter("CustomColor:", DefaultValue = "White", Group = "==== Numerical Renko Bars ====")]
public Color CustomNumbersColor { get; set; }
[Parameter("Up Wave Color", DefaultValue = "SeaGreen", Group = "==== Waves Information ====")]
public Color UpWaveColor { get; set; }
[Parameter("Down Wave Color", DefaultValue = "OrangeRed", Group = "==== Waves Information ====")]
public Color DownWaveColor { get; set; }
[Parameter("Effort vs Result Ratio", DefaultValue = 1.5, MinValue = 0, Group = "==== Waves Ratio ====")]
public double EvsR_Ratio { get; set; }
[Parameter("Large Weis Waves Ratio", DefaultValue = 1.5, MinValue = 0, Group = "==== Waves Ratio ====")]
public double WW_Ratio { get; set; }
[Parameter("Large WW/EvsR Color", DefaultValue = "Yellow", Group = "==== Waves Ratio ====")]
public Color LargeColor { get; set; }
[Parameter("MA Filter Type:", DefaultValue = MovingAverageType.Exponential, Group = "==== Moving Average for Numbers/Bars Colors ====")]
public MovingAverageType MAtype { get; set; }
[Parameter("MA Filter Period:", DefaultValue = 5, MinValue = 1, Group = "==== Moving Average for Numbers/Bars Colors ====")]
public int MAperiod { get; set; }
[Parameter("Show TrendLines?", DefaultValue = true, Group = "==== Trend Lines Settings ====")]
public bool ShowTrendLines { get; set; }
[Parameter("NoTrend Line Color", DefaultValue = "SteelBlue", Group = "==== Trend Lines Settings ====")]
public Color NoTrendColor { get; set; }
[Parameter("UpTrend Line Color", DefaultValue = "Green", Group = "==== Trend Lines Settings ====")]
public Color UpLineColor { get; set; }
[Parameter("DownTrend Line Color", DefaultValue = "Red", Group = "==== Trend Lines Settings ====")]
public Color DownLineColor { get; set; }
[Parameter("Transcribed & Improved", DefaultValue = "for cTrader/C# by srlcarlg", Group = "==== Credits ====")]
public string Credits { get; set; }
[Parameter("Original Code Concepts", DefaultValue = "in TDV/Pinescript by akutsusho", Group = "==== Credits ====")]
public string Credits_2 { get; set; }
/*
Using TrendLines instead of Output.Line because
I want to enable/disable lines WITHOUT having to click 3 buttons or set 3 different colors to Transparent
[after some time...]
It is possible to disable the lines with one parameter in the Output.Line Method,
I still keep the trendlines because "who wants to know the numerical information of a line"? hahaha
*/
// ======= Weis Wave & Wyckoff System =======
string[] Bars_Colors = { "", "", "", "", "", "", "" };
string[] Numbers_Colors = { "", "", "", "", "", "", "" };
private IndicatorDataSeries renkoAllTimes;
private MovingAverage MATime, MAVol;
private double prevWaveVol_Up;
private double prevWaveVol_Down;
private double prevVolPrice_Up;
private double prevVolPrice_Down;
double[] prevCumul_Up = { 0, 0 };
double[] prevCumul_Down = { 0, 0 };
// Volume/Cumulative Renko = EvsR
double[] prevWaves_VolPrice = { 0, 0, 0, 0 };
// onlyVolume = Large WW
double[] prevWaves_Vol = { 0, 0, 0, 0 };
private bool WrongTF = false;
private int PipsMutliplier = 1;
private readonly IDictionary<int, ChartText> textsBars = new Dictionary<int, ChartText>();
// ======= Zig Zag =======
enum Direction
{
up,
down
}
private Direction direction = Direction.down;
private double extremumPrice = 0.0;
private int extremumIndex = 0;
private int trendStartIndex = 0;
private IndicatorDataSeries TrendBuffer;
// ======= Volume Renko&Range =======
private DateTime FromDateTime;
private IndicatorDataSeries VolumeRR;
private Bars _TicksOHLC;
private int CurrentVol = 0;
// ======= Renko Wicks =======
private IndicatorDataSeries AllWicks;
private Color UpWickColor;
private Color DownWickColor;
private readonly List<double> currentPriceWicks = new();
private readonly List<ChartTrendLine> TrendLinesWicks = new();
private readonly VerticalAlignment V_Align = VerticalAlignment.Top;
private readonly HorizontalAlignment H_Align = HorizontalAlignment.Center;
// Moved from cTrader Input to Params Panel
public int Lookback { get; set; } = -1;
public enum NumbersData
{
Both,
Volume,
Time
}
public NumbersData ShowNumbersInput { get; set; } = NumbersData.Both;
public enum NumbersPositionData
{
Inside,
Outside,
}
public NumbersPositionData NumbersPositionInput { get; set; } = NumbersPositionData.Inside;
public enum NumbersColorData
{
Volume,
Time,
CustomColor
}
public NumbersColorData NumbersColorInput { get; set; } = NumbersColorData.Volume;
public bool BarsFillBool { get; set; } = true;
public bool BarsOutlineBool { get; set; } = false;
public enum BarsColorData
{
Volume,
Time,
}
public BarsColorData BarsColorInput { get; set; } = BarsColorData.Volume;
public enum ShowWavesData
{
No,
Both,
Volume,
EffortvsResult
}
public ShowWavesData ShowWavesInput { get; set; } = ShowWavesData.Volume;
public enum ShowOtherWaves_Data
{
No,
Both,
Price,
Time
}
public ShowOtherWaves_Data ShowOtherWaves_Input { get; set; } = ShowOtherWaves_Data.Both;
public enum ShowMarksData
{
No,
Both,
Left,
Right
}
public ShowMarksData ShowMarksInput { get; set; } = ShowMarksData.No;
public enum RepaintData
{
No,
itsRepaint,
}
public RepaintData RepaintInput { get; set; } = RepaintData.No;
// Params Panel
private Border ParamBorder;
public class IndicatorParams
{
public int LookBack { get; set; }
public NumbersData ShowNumbers { get; set; }
public NumbersPositionData NumbersPosition { get; set; }
public NumbersColorData NumbersColor { get; set; }
public bool BarsFillBool { get; set; }
public bool BarsOutlineBool { get; set; }
public BarsColorData BarsColor { get; set; }
public ShowWavesData ShowWaves { get; set; }
public ShowOtherWaves_Data ShowOtherWaves { get; set; }
public ShowMarksData ShowMarks { get; set; }
public RepaintData RepaintWaves { get; set; }
}
private void AddHiddenButton(Panel panel, Color btnColor)
{
Button button = new()
{
Text = "WWS",
Padding = 0,
Height = 22,
Margin = 2,
BackgroundColor = btnColor
};
button.Click += HiddenEvent;
panel.AddChild(button);
}
private void HiddenEvent(ButtonClickEventArgs obj)
{
if (ParamBorder.IsVisible)
ParamBorder.IsVisible = false;
else
ParamBorder.IsVisible = true;
}
protected override void Initialize()
{
// ===== Verify Timeframe =====
string currentTimeframe = Chart.TimeFrame.ToString();
if (!currentTimeframe.Contains("Renko"))
{
DrawOnScreen($"Weis&Wyckoff System \n WORKS ONLY IN RENKO CHART!");
WrongTF = true;
return;
}
// ===== Settings Bars/Numbers Colors =====
if (NumbersPositionInput == NumbersPositionData.Outside)
{
// Colors
string[] B_Colors = { "EE3E3E40", "EE8F9092", "DDFFFFFF", "EEA1F6A1", "EE1D8934", "EEFA6681", "EEE00106" };
Bars_Colors = B_Colors;
string[] N_Colors = { "EE3E3E40", "EE8F9092", "DDFFFFFF", "EEA1F6A1", "EE1D8934", "EEFA6681", "EEE00106" };
Numbers_Colors = N_Colors;
}
else if (NumbersPositionInput == NumbersPositionData.Inside)
{
// Colors
string[] B_Colors = { "843E3E40", "658F9092", "65FFFFFF", "65A1F6A1", "651D8934", "65FA6681", "65E00106" };
Bars_Colors = B_Colors;
string[] N_Colors = { "FF3E3E40", "FF8F9092", "FFFFFFFF", "FFA1F6A1", "FF1D8934", "FFFA6681", "FFE00106" };
Numbers_Colors = N_Colors;
}
if (NumbersPositionInput == NumbersPositionData.Outside)
{
/* As it's a combination that won't be used much,
and btw drawing this combination is a little tiring,
I left it out. */
if (ShowNumbersInput == NumbersData.Both && (ShowWavesInput == ShowWavesData.Both || ShowWavesInput == ShowWavesData.Volume || ShowWavesInput == ShowWavesData.EffortvsResult))
{
Print("W.WAVES POSITIONS in OUTSIDE NUMBERS OPTION is not optimized for BOTH NUMBERS OPTION, setting BOTH to VOLUME instead");
ShowNumbersInput = NumbersData.Volume;
}
else if (ShowNumbersInput == NumbersData.Both && (ShowOtherWaves_Input == ShowOtherWaves_Data.Both || ShowOtherWaves_Input == ShowOtherWaves_Data.Price || ShowOtherWaves_Input == ShowOtherWaves_Data.Time))
{
Print("W.Waves POSITIONS in OUTSIDE NUMBERS OPTION is not optimized for BOTH NUMBERS OPTION, setting BOTH to VOLUME instead");
ShowNumbersInput = NumbersData.Volume;
}
}
// ===== Volume RR Inicialization =====
_TicksOHLC = MarketData.GetBars(TimeFrame.Tick);
Bars.BarOpened += ResetCurrentVol;
VolumeRR = CreateDataSeries();
VolumeInitialize();
// ===== Renko Wicks Inicialization =====
AllWicks = CreateDataSeries();
Bars.BarOpened += ResetCurrentWick;
Chart.ColorsChanged += SetTrendLinesColor;
// ===== Coloring Volume&Time / Numeric Renko Inicialization / Wyckoff Part =====
renkoAllTimes = CreateDataSeries();
MATime = Indicators.MovingAverage(renkoAllTimes, MAperiod, MAtype);
MAVol = Indicators.MovingAverage(VolumeRR, MAperiod, MAtype);
if (Symbol.Digits == 2 && Symbol.PipSize == 0.1)
PipsMutliplier = 10;
Chart.ChartTypeChanged += SetNumbersPositionEvent;
TrendBuffer = CreateDataSeries();
// PARAMS PANEL
VerticalAlignment vAlign = VerticalAlignment.Bottom;
HorizontalAlignment hAlign = HorizontalAlignment.Right;
if (PanelAlignInput == PanelAlignData.Bottom_Left)
hAlign = HorizontalAlignment.Left;
else if (PanelAlignInput == PanelAlignData.Top_Left)
vAlign = VerticalAlignment.Top;
else if (PanelAlignInput == PanelAlignData.Top_Right) {
vAlign = VerticalAlignment.Top;
hAlign = HorizontalAlignment.Right;
} else if (PanelAlignInput == PanelAlignData.Center_Right) {
vAlign = VerticalAlignment.Center;
hAlign = HorizontalAlignment.Right;
} else if (PanelAlignInput == PanelAlignData.Center_Left) {
vAlign = VerticalAlignment.Center;
hAlign = HorizontalAlignment.Left;
} else if (PanelAlignInput == PanelAlignData.Top_Center) {
vAlign = VerticalAlignment.Top;
hAlign = HorizontalAlignment.Center;
} else if (PanelAlignInput == PanelAlignData.Bottom_Center) {
vAlign = VerticalAlignment.Bottom;
hAlign = HorizontalAlignment.Center;
}
IndicatorParams DefaultParams = new()
{
LookBack = Lookback,
ShowNumbers = ShowNumbersInput,
NumbersPosition = NumbersPositionInput,
NumbersColor = NumbersColorInput,
BarsFillBool = BarsFillBool,
BarsOutlineBool = BarsOutlineBool,
BarsColor = BarsColorInput,
ShowWaves = ShowWavesInput,
ShowOtherWaves = ShowOtherWaves_Input,
ShowMarks = ShowMarksInput,
RepaintWaves = RepaintInput
};
ParamsPanel ParamPanel = new(this, DefaultParams);
Border borderParam = new()
{
VerticalAlignment = vAlign,
HorizontalAlignment = hAlign,
Style = Styles.CreatePanelBackgroundStyle(),
Margin = "20 40 20 20",
Width = 225,
Child = ParamPanel
};
Chart.AddControl(borderParam);
ParamBorder = borderParam;
var wrapPanel = new WrapPanel
{
VerticalAlignment = vAlign,
HorizontalAlignment = hAlign,
};
AddHiddenButton(wrapPanel, Color.Gray);
Chart.AddControl(wrapPanel);
}
public override void Calculate(int index)
{
if (WrongTF)
return;
// ==== Removing Messages + Others ====
if (IsLastBar)
{
CurrentVol += 1;
if (ShowWicks)
currentPriceWicks.Add(Bars.ClosePrices[index]);
}
else
DrawOnScreen("");
if (index < (Bars.OpenTimes.GetIndexByTime(Server.Time)-Lookback) && Lookback != -1 && Lookback > 0)
{
Chart.SetBarOutlineColor(index, Bars_Colors[1]);
Chart.SetBarFillColor(index, Bars_Colors[1]);
return;
}
// ==== Volume RR ====
DateTime CurrentTimeBar = Bars.OpenTimes[index];
DateTime PreviousTimeBar = Bars.OpenTimes[index - 1];
VolumeRR[index - 1] = Get_Volume_or_Wicks(PreviousTimeBar, CurrentTimeBar, true);
VolumeRR[index] = CurrentVol;
// ==== Coloring Renko Bars ====
Standard_Colors(index);
// ==== Weis Wave ====
WeisWaveSystem(index);
// ==== Renko Wicks ====
if (ShowWicks)
RenkoWicks(index);
// Live Volume
ChartText dyntext = Chart.DrawText($"liveVol", $"\n{CurrentVol}", index, Bars.ClosePrices[index], Color.White);
dyntext.HorizontalAlignment = HorizontalAlignment.Center;
// Live Time
DateTime c_prevTime = Bars.OpenTimes[index];
DateTime c_currentTime2 = Server.Time;
TimeSpan c_interval = c_currentTime2.Subtract(c_prevTime);
double interval_ms = c_interval.TotalMilliseconds;
string[] interval_tlapse = DynTimeLapse(interval_ms);
double dynInterval = Convert.ToDouble(interval_tlapse[0]);
string actualTimeLapse = interval_tlapse[1];
ChartText dyntext_t = Chart.DrawText($"liveTimer", $"{Math.Round(dynInterval) + actualTimeLapse}", index, Bars.ClosePrices[index], Color.White);
dyntext_t.HorizontalAlignment = HorizontalAlignment.Center;
}
private void Standard_Colors(int index)
{
// =========== Timer ===========
// Previous Interval
DateTime prevTime = Bars.OpenTimes[index - 2];
DateTime currentTime = Bars.OpenTimes[index - 1];
TimeSpan interval = currentTime.Subtract(prevTime);
double interval_ms = interval.TotalMilliseconds;
// Dynamic TimeLapse Format
string[] interval_tlapse = DynTimeLapse(interval_ms);
double dynInterval = Convert.ToDouble(interval_tlapse[0]);
string actualTimeLapse = interval_tlapse[1];
// -----------------
renkoAllTimes[index - 1] = dynInterval;
// Current Interval
DateTime c_prevTime = Bars.OpenTimes[index - 1];
DateTime c_currentTime2 = Bars.OpenTimes[index];
TimeSpan c_interval = c_currentTime2.Subtract(c_prevTime);
double c_interval_ms = c_interval.TotalMilliseconds;
// -----------------
renkoAllTimes[index] = c_interval_ms;
// =========== Time Filter ===========
double rawTimeFilter = dynInterval / MATime.Result[index - 1];
string strTimeFilter = Filtered_TwoDecimais();
string Filtered_TwoDecimais()
{
string[] rawStr = rawTimeFilter.ToString().Split(',');
if (rawStr.Length == 1)
return rawStr[0];
string rawDecimais = rawStr[1];
string twoDecimais = rawDecimais.Substring(0, 2);
return $"{rawStr[0]},{twoDecimais}";
}
double timeFilter = Math.Round(Convert.ToDouble(strTimeFilter), 1);
double timeLarge = timeFilter > 1 ? Math.Round(dynInterval) : 0;
// =========== Volume Filter ===========
double volumeFilter = VolumeRR[index - 1] / MAVol.Result[index - 1];
double volumeLarge = volumeFilter > 1 ? VolumeRR[index - 1] : 0;
// ========== Drawing ==========
// --- Color type ---
double colorTypeNumbers = NumbersColorInput == NumbersColorData.Time ? timeFilter : volumeFilter;
double colorTypeBars = BarsColorInput == BarsColorData.Time ? timeFilter : volumeFilter;
// --- Y-Axis ---
bool isBullish = Bars.ClosePrices[index - 1] > Bars.OpenPrices[index - 1];
double y_Up = Bars.ClosePrices[index - 1];
double y_Down = Bars.OpenPrices[index - 1];
// --- Shows Dynamic Time/Volume ---
string strTimeLarge = timeLarge != 0 ? timeLarge.ToString() + actualTimeLapse : "";
string strVolLarge = volumeLarge != 0 ? volumeLarge.ToString() : "";
string onlyTime = ShowOnlyLargeBool ? $"{strTimeLarge}" : $"{Math.Round(dynInterval) + actualTimeLapse}";
string onlyVol = ShowOnlyLargeBool ? $"{strVolLarge}" : $"{SetDigits(VolumeRR[index - 1])}";
string dynLargePosition;
string VolTime;
if (NumbersBothPositionInput == NumbersBothPositionData.Default)
{
dynLargePosition = strTimeLarge == "" ? $"{strVolLarge}" : strVolLarge == "" ? $"{strTimeLarge}" : $"{Math.Round(dynInterval) + actualTimeLapse}\n{SetDigits(VolumeRR[index - 1])}";
VolTime = ShowOnlyLargeBool ? dynLargePosition : $"{Math.Round(dynInterval) + actualTimeLapse}\n{SetDigits(VolumeRR[index - 1])}";
}
else
{
dynLargePosition = strTimeLarge == "" ? $"{strVolLarge}" : strVolLarge == "" ? $"{strTimeLarge}" : $"{SetDigits(VolumeRR[index - 1])}\n{Math.Round(dynInterval) + actualTimeLapse}";
VolTime = ShowOnlyLargeBool ? dynLargePosition : $"{SetDigits(VolumeRR[index - 1])}\n{Math.Round(dynInterval) + actualTimeLapse}";
}
// --- Shows Time/Volume/Both ---
var selectedNumbers = ShowNumbersInput;
string dynString = selectedNumbers == NumbersData.Time ? onlyTime : selectedNumbers == NumbersData.Volume ? onlyVol : VolTime;
// === Up ===
if (isBullish)
{
if (y_Up.ToString() == "NaN")
return;
// Number/Bar Color
Color dynNumberColor = colorTypeNumbers > 2 ? Numbers_Colors[4] : colorTypeNumbers > 1.5 ? Numbers_Colors[3] : colorTypeNumbers > 1 ? Numbers_Colors[2] : colorTypeNumbers > 0.5 ? Numbers_Colors[1] : Numbers_Colors[0];
Color dynBarColor = colorTypeBars > 2 ? Bars_Colors[4] : colorTypeBars > 1.5 ? Bars_Colors[3] : colorTypeBars > 1 ? Bars_Colors[2] : colorTypeBars > 0.5 ? Bars_Colors[1] : Bars_Colors[0];
if (VolumeRR[index-1] != 0)
{
ChartText dyntext = Chart.DrawText($"VolTimeUp_{index - 1}", dynString, index - 1, y_Up, dynNumberColor);
// Positions Settings + Others
if (Chart.ChartType != ChartType.Bars && Chart.ChartType != ChartType.Hlc)
{
if (NumbersPositionInput == NumbersPositionData.Outside)
dyntext.VerticalAlignment = VerticalAlignment.Top;
dyntext.HorizontalAlignment = HorizontalAlignment.Center;
}
else
dyntext.HorizontalAlignment = HorizontalAlignment.Stretch;
dyntext.Comment = "Up";
if (NumbersColorInput == NumbersColorData.CustomColor)
dyntext.Color = CustomNumbersColor;
if (!textsBars.ContainsKey(index-1))
textsBars.Add(index - 1, dyntext);
else
textsBars[index-1] = dyntext;
}
// Fill + Outline Settings
if (!BarsFillBool && !BarsOutlineBool)
{
Chart.SetBarFillColor(index - 1, Color.Transparent);
Chart.SetBarOutlineColor(index - 1, dynBarColor);
UpWickColor = dynBarColor;
}
else if (BarsFillBool && BarsOutlineBool)
{
Chart.SetBarFillColor(index - 1, dynBarColor);
UpWickColor = Chart.ColorSettings.BullOutlineColor;
}
else if (!BarsFillBool && BarsOutlineBool)
{
Chart.SetBarFillColor(index - 1, Color.Transparent);
UpWickColor = Chart.ColorSettings.BullOutlineColor;
}
else if (BarsFillBool && !BarsOutlineBool)
{
Chart.SetBarColor(index - 1, dynBarColor);
UpWickColor = dynBarColor;
}
}
// === Down ===
else
{
if (y_Down.ToString() == "NaN")
return;
// Number/Bar Color
Color dynNumberColor = colorTypeNumbers > 2 ? Numbers_Colors[6] : colorTypeNumbers > 1.5 ? Numbers_Colors[5] : colorTypeNumbers > 1 ? Numbers_Colors[2] : colorTypeNumbers > 0.5 ? Numbers_Colors[1] : Numbers_Colors[0];
Color dynBarColor = colorTypeBars > 2 ? Bars_Colors[6] : colorTypeBars > 1.5 ? Bars_Colors[5] : colorTypeBars > 1 ? Bars_Colors[2] : colorTypeBars > 0.5 ? Bars_Colors[1] : Bars_Colors[0];
if (VolumeRR[index-1] != 0)
{
ChartText dyntext = Chart.DrawText($"VolTimeUp_{index - 1}", dynString, index - 1, y_Down, dynNumberColor);
// Positions Settings + Others
if (Chart.ChartType != ChartType.Bars && Chart.ChartType != ChartType.Hlc)
{
if (NumbersPositionInput == NumbersPositionData.Outside)
dyntext.Y = y_Up;
dyntext.HorizontalAlignment = HorizontalAlignment.Center;
}
else
dyntext.HorizontalAlignment = HorizontalAlignment.Stretch;
dyntext.Comment = "Down";
if (NumbersColorInput == NumbersColorData.CustomColor)
dyntext.Color = CustomNumbersColor;
if (!textsBars.ContainsKey(index-1))
textsBars.Add(index - 1, dyntext);
else
textsBars[index-1] = dyntext;
}
// Fill + Outline Settings
if (!BarsFillBool && !BarsOutlineBool)
{
Chart.SetBarFillColor(index - 1, Color.Transparent);
Chart.SetBarOutlineColor(index - 1, dynBarColor);
DownWickColor = dynBarColor;
}
else if (BarsFillBool && BarsOutlineBool)
{
Chart.SetBarFillColor(index - 1, dynBarColor);
DownWickColor = Chart.ColorSettings.BearOutlineColor;
}
else if (!BarsFillBool && BarsOutlineBool)
{
Chart.SetBarFillColor(index - 1, Color.Transparent);
DownWickColor = Chart.ColorSettings.BearOutlineColor;
}
else if (BarsFillBool && !BarsOutlineBool)
{
Chart.SetBarColor(index - 1, dynBarColor);
DownWickColor = dynBarColor;
}
}
}
// ========= ========== ==========
private void SetNumbersPositionEvent(ChartTypeEventArgs obj)
{
if (NumbersPositionInput == NumbersPositionData.Outside) {
return;
}
ChartText first = textsBars.Values.FirstOrDefault();
bool alreadySet_Bars = first.HorizontalAlignment == HorizontalAlignment.Stretch;
bool alreadySet_Candlesticks = first.HorizontalAlignment == HorizontalAlignment.Center;
if ((Chart.ChartType == ChartType.Bars || Chart.ChartType == ChartType.Hlc)
&& !alreadySet_Bars)
{
foreach (var key in textsBars.Keys)
{
if (textsBars[key].Comment == "Up")
textsBars[key].HorizontalAlignment = HorizontalAlignment.Stretch;
else
textsBars[key].HorizontalAlignment = HorizontalAlignment.Stretch;
}
}
else if (obj.Chart.ChartType == ChartType.Candlesticks && !alreadySet_Candlesticks)
{
foreach (var key in textsBars.Keys)
{
if (textsBars[key].Comment == "Up")
textsBars[key].HorizontalAlignment = HorizontalAlignment.Center;
else
textsBars[key].HorizontalAlignment = HorizontalAlignment.Center;
}
}
}
// ========= ========== ==========
private double SetDigits(double Number, bool haveComma=false)
{
if (DigitsToViewInput == DigitsToView.All || Number == 0 || Number.ToString() == "NaN" || Number.ToString().Length == 1)
return Number;
if (!haveComma)
{
string strNumber = Number.ToString();
int dynDigits = DigitsToViewInput == DigitsToView._4_Digits ? 4 : 3;
string newValue = strNumber;
if (dynDigits == 4)
{
for (int i = 0; i < newValue.Length; i++)
{
if (strNumber.Length == dynDigits+1)
{
if (strNumber.Length == 2)
break;
newValue = strNumber.Remove(strNumber.Length - 1);
break;
}
else if (newValue.Length > dynDigits)
newValue = newValue.Remove(newValue.Length - 1);
else
break;
}
}
else
{
for (int i = 0; i < newValue.Length; i++)
{
if (strNumber.Length == 3)
{
newValue = strNumber.Remove(strNumber.Length - 1);
break;
}
else if (strNumber.Length == dynDigits+1)
{
if (strNumber.Length == 2)
break;
newValue = strNumber.Remove(strNumber.Length - 1);
break;
}
else if (newValue.Length > dynDigits)
newValue = newValue.Remove(newValue.Length - 1);
else
break;
}
}
return Convert.ToDouble(newValue);
}
else
{
string strNumber = Number.ToString().Replace(",", "");
int dynDigits = DigitsToViewInput == DigitsToView._4_Digits ? 4 : 5;
string newValue = strNumber;
for (int i = 0; i < newValue.Length; i++)
{
if (strNumber.Length == dynDigits+1)
{
if (strNumber.Length <= 2)
break;
newValue = strNumber.Remove(strNumber.Length - 1);
break;
}
if (newValue.Length > dynDigits+1)
newValue = newValue.Remove(newValue.Length - 1);
else
break;
}
char last = newValue.Last();
string removedLast = newValue.Remove(newValue.Length - 1);
string newStr = $"{removedLast}{last}";
return Convert.ToDouble(newStr);
}
}
// ************************** VOLUME RENKO/RANGE **************************
/*
Original source code by srlcarlg (me) (https://ctrader.com/algos/indicators/show/3045)
*/
private void VolumeInitialize()
{
if (LoadFromInput == LoadFromData.Custom)
{
// ==== Get datetime to load from: dd/mm/yyyy ====
if (DateTime.TryParseExact(StringDate, "dd/mm/yyyy", new CultureInfo("en-US"), DateTimeStyles.None, out FromDateTime))
{
if (FromDateTime > Server.Time.Date) {
// for Log
FromDateTime = Server.Time.Date;
Print($"Invalid DateTime '{StringDate}'. Using '{FromDateTime}'");
}
}
else {
// for Log
FromDateTime = Server.Time.Date;
Print($"Invalid DateTime '{StringDate}'. Using '{FromDateTime}'");
}
}
else
{
DateTime LastBarTime = Bars.LastBar.OpenTime.Date;
if (LoadFromInput == LoadFromData.Today)
FromDateTime = LastBarTime.Date;
else if (LoadFromInput == LoadFromData.Yesterday)
FromDateTime = LastBarTime.AddDays(-1);
else if (LoadFromInput == LoadFromData.One_Week)
FromDateTime = LastBarTime.AddDays(-5);
else if (LoadFromInput == LoadFromData.Two_Week)
FromDateTime = LastBarTime.AddDays(-10);
else if (LoadFromInput == LoadFromData.Monthly)
FromDateTime = LastBarTime.AddMonths(-1);
}
// ==== Check if existing ticks data on the chart really needs more data ====
DateTime FirstTickTime = _TicksOHLC.OpenTimes.FirstOrDefault();
if (FirstTickTime >= FromDateTime) {
LoadMoreTicks(FromDateTime);
DrawOnScreen("Data Collection Finished \n Calculating...");
}
else {
Print($"Using existing tick data from '{FirstTickTime}'");
DrawOnScreen($"Using existing tick data from '{FirstTickTime}' \n Calculating...");
}
}
// ========= ========== ==========
private double Get_Volume_or_Wicks(DateTime startTime, DateTime endTime, bool isVolume, bool isBullish = false)
{
int volume = 0;
double min = Int32.MaxValue;
double max = 0;
for (int tickIndex = 0; tickIndex < _TicksOHLC.Count; tickIndex++)
{
Bar tickBar = _TicksOHLC[tickIndex];
if (tickBar.OpenTime < startTime || tickBar.OpenTime > endTime)
{
if (tickBar.OpenTime > endTime)
break;
else
continue;
}
volume += 1;
if (isBullish && !isVolume && tickBar.Close < min)
min = tickBar.Close;
else if (!isBullish && !isVolume && tickBar.Close > max)
max = tickBar.Close;
}
if (isVolume)
return volume;
else
return isBullish ? min : max;
}
// ========= ========== ==========
private void LoadMoreTicks(DateTime FromDateTime)
{
bool msg = false;
while (_TicksOHLC.OpenTimes.FirstOrDefault() > FromDateTime)
{
if (!msg) {
Print($"Loading from '{_TicksOHLC.OpenTimes.First()}' to '{FromDateTime}'...");
msg = true;
}
int loadedCount = _TicksOHLC.LoadMoreHistory();
Print("Loaded {0} Ticks, Current Tick Date: {1}", loadedCount, _TicksOHLC.OpenTimes.FirstOrDefault());
if (loadedCount == 0)
break;
}
Print("Data Collection Finished, First Tick from: {0}", _TicksOHLC.OpenTimes.FirstOrDefault());
}
// ========= ========== ==========
private void ResetCurrentVol(BarOpenedEventArgs obj)
{
CurrentVol = 0;
}
// ************************** RENKO WICKS **************************
/*
Original source code by srlcarlg (me) (https://ctrader.com/algos/indicators/show/3046)
*/
private void RenkoWicks(int index)
{
DateTime CurrentTimeBar = Bars.OpenTimes[index];
DateTime PreviousTimeBar = Bars.OpenTimes[index - 1];
double PrevOpen = Bars.OpenPrices[index - 1];
bool isBullish = (Bars.ClosePrices[index - 1] > Bars.OpenPrices[index - 1]);
bool currentisBullish = (Bars.ClosePrices[index] > Bars.OpenPrices[index]);
bool Gap = Bars.OpenTimes[index - 1] == Bars.OpenTimes[index - 2];
// ==============
AllWicks[index - 1] = Get_Volume_or_Wicks(PreviousTimeBar, CurrentTimeBar, false, isBullish);
// ==== HISTORICAL Up WICK ====
if (isBullish)
{
if (AllWicks[index - 1] < PrevOpen && !Gap)
{
ChartTrendLine trendUp = Chart.DrawTrendLine("UpWick_" + (index - 1), PreviousTimeBar, AllWicks[index - 1], PreviousTimeBar, Bars.OpenPrices[index - 1], UpWickColor);
trendUp.Thickness = Thickness;
trendUp.Comment = "UpWick";
TrendLinesWicks.Add(trendUp);
}
}
// ==== HISTORICAL Down WICK ====
else
{
if (AllWicks[index - 1] > PrevOpen && !Gap)
{
ChartTrendLine trendDown = Chart.DrawTrendLine("DownWick_" + (index - 1), PreviousTimeBar, AllWicks[index - 1], PreviousTimeBar, Bars.OpenPrices[index - 1], DownWickColor);
trendDown.Thickness = Thickness;
trendDown.Comment = "DownWick";
TrendLinesWicks.Add(trendDown);
}
}
// ==== CURRENT Up WICK ====
if (currentisBullish)
{
if (currentPriceWicks.Count == 0)
return;
AllWicks[index] = currentPriceWicks.Min();
ChartTrendLine currentTrendUp = Chart.DrawTrendLine("currentPriceLines", CurrentTimeBar, AllWicks[index], CurrentTimeBar, currentPriceWicks.Max(), UpWickColor);
currentTrendUp.Thickness = Thickness;
}
// ==== CURRENT Down WICK ====
else
{
if (currentPriceWicks.Count == 0)
return;
AllWicks[index] = currentPriceWicks.Max();
ChartTrendLine currentTrendDown = Chart.DrawTrendLine("currentPriceLines", CurrentTimeBar, AllWicks[index], CurrentTimeBar, currentPriceWicks.Min(), DownWickColor);
currentTrendDown.Thickness = Thickness;
}
}
// ========= Functions Area ==========
private void ResetCurrentWick(BarOpenedEventArgs obj)
{
currentPriceWicks.Clear();
Chart.RemoveObject("currentPriceLines");
}
// ========= ========== ==========
private void DrawOnScreen(string Msg)
{
Chart.DrawStaticText("txt", $"{Msg}", V_Align, H_Align, Color.Orange);
}
// ========= ========== ==========
private void SetTrendLinesColor(ChartColorEventArgs obj)
{
if (obj.Chart.ColorSettings.BullOutlineColor != UpWickColor)
{
for (int wickIndex = 0; wickIndex < TrendLinesWicks.Count; wickIndex++)
{
if (TrendLinesWicks[wickIndex].Comment == "UpWick")
TrendLinesWicks[wickIndex].Color = obj.Chart.ColorSettings.BullOutlineColor;
}
UpWickColor = obj.Chart.ColorSettings.BullOutlineColor;
}
if (obj.Chart.ColorSettings.BearOutlineColor != DownWickColor)
{
for (int wickIndex = 0; wickIndex < TrendLinesWicks.Count; wickIndex++)
{
if (TrendLinesWicks[wickIndex].Comment == "DownWick")
TrendLinesWicks[wickIndex].Color = obj.Chart.ColorSettings.BearOutlineColor;
}
DownWickColor = obj.Chart.ColorSettings.BearOutlineColor;
}
}
// ************************ WEIS WAVE SYSTEM **************************
/*
Improved Weis Waves
by
srlcarlg
====== References for Studies ======
(Numbers-Renko 数字練行足) by akutsusho (https://www.tradingview.com/script/9BKOIhdl-Numbers-Renko) (Code concepts in PineScript)
(Swing Gann) by TradeExperto (https://ctrader.com/algos/indicators/show/2521) (helped a lot in the structure of the calculation of waves)
(ZigZag) by mike.ourednik (https://ctrader.com/algos/indicators/show/1419) (also, decreased a lot of code)
*/
private void WeisWaveSystem(int rawIndex)
{
int index;
if (RepaintInput == RepaintData.No)
index = rawIndex - 2;
else
index = rawIndex - 1;
if (index < 2)
return;
double low = Bars.LowPrices[index];
double high = Bars.HighPrices[index];
if (extremumPrice == 0.0)
extremumPrice = high;
if (direction == Direction.down)
{
if (low <= extremumPrice)
moveExtremum(index, low);
else if (high >= extremumPrice * (1.0 + 0.01 * 0.01))
{
setExtremum(index, high);
direction = Direction.up;
}
}
else
{
if (high >= extremumPrice)
moveExtremum(index, high);
else if (low <= extremumPrice * (1.0 - 0.01 * 0.01))
{
setExtremum(index, low);
direction = Direction.down;
}
}
// ===== Local Functions Area =====
void moveExtremum(int index, double price)
{
// Need
TrendBuffer[extremumIndex+1] = Bars.OpenPrices[index];
// === Calculate Wave = In Trend ===
bool dynCurrentUpDw = Bars.ClosePrices[index] > Bars.OpenPrices[index];
if (dynCurrentUpDw)
{
CalculateWaves(1, trendStartIndex, index, ShowWavesInput, trendStartIndex, false);
if (ShowTrendLines)
Chart.DrawTrendLine("TrendLine" + trendStartIndex, trendStartIndex, Bars.OpenPrices[trendStartIndex], index, Bars.OpenPrices[index], Color.Green);
/*
In Output.Line Method, just do:
UpLine[index] = TrendBuffer[extremumIndex+1];
DownLine[index] = double.NaN;
*/
}
else
{
CalculateWaves(3, trendStartIndex, index, ShowWavesInput, trendStartIndex, false);
if (ShowTrendLines)
Chart.DrawTrendLine("TrendLine" + trendStartIndex, trendStartIndex, Bars.OpenPrices[trendStartIndex], index, Bars.OpenPrices[index], Color.Red);
/*
In Output.Line Method, just do:
DownLine[index] = TrendBuffer[extremumIndex+1];
UpLine[index] = double.NaN;
*/
}
setExtremum(index, price);
}
// ========= ========== ==========
void setExtremum(int index, double price)
{
// I had to change the parameter index to indexBar because cTrader on .NET 4.x is slow and boring :)
// cTrader on .NET 6.0, parameter named in index works normally
extremumIndex = index;
extremumPrice = price;
TrendBuffer[extremumIndex+1] = extremumPrice;
if (DirectionChanged(index))
{
// Current index is the end of trend
// === Calculate Wave = Final Trend ===
bool dynCurrentUpDw = Bars.ClosePrices[index] > Bars.OpenPrices[index];
bool prevIsUp = Bars.ClosePrices[index - 1] > Bars.OpenPrices[index - 1];
bool nextIsUp = Bars.ClosePrices[index + 1] > Bars.OpenPrices[index + 1];
bool prevIsDown = Bars.ClosePrices[index - 1] < Bars.OpenPrices[index - 1];
bool nextIsDown = Bars.ClosePrices[index + 1] < Bars.OpenPrices[index + 1];
if (dynCurrentUpDw)
{
CalculateWaves(1, trendStartIndex, index, ShowWavesInput, trendStartIndex, true);
if (ShowTrendLines)
{
Chart.DrawTrendLine("TrendLine" + trendStartIndex, trendStartIndex, Bars.OpenPrices[trendStartIndex], index, Bars.OpenPrices[index], UpLineColor);
Chart.DrawTrendLine("TrendLine" + extremumIndex, index + 1, Bars.OpenPrices[index+1], index, Bars.OpenPrices[index], NoTrendColor);
Chart.DrawTrendLine("TrendLine" + extremumIndex, index + 1, Bars.OpenPrices[index+1], index, Bars.OpenPrices[index+1], NoTrendColor);
}
/*
In Output.Line Method, just do:
UpLine[index] = TrendBuffer[extremumIndex+1];
DownLine[index] = double.NaN;
*/
}
else
{
int dynEndIndex = (prevIsDown && dynCurrentUpDw && nextIsDown) || (prevIsUp && !dynCurrentUpDw && nextIsUp) ? trendStartIndex : index;
CalculateWaves(3, trendStartIndex, index, ShowWavesInput, trendStartIndex, true);
if (ShowTrendLines)
{
Chart.DrawTrendLine("TrendLine" + trendStartIndex, trendStartIndex, Bars.OpenPrices[trendStartIndex], index, Bars.OpenPrices[index], DownLineColor);
Chart.DrawTrendLine("TrendLine" + extremumIndex, index + 1, Bars.OpenPrices[index+1], dynEndIndex, Bars.OpenPrices[index], NoTrendColor);
Chart.DrawTrendLine("TrendLine" + extremumIndex, index + 1, Bars.OpenPrices[index+1], index, Bars.OpenPrices[index+1], NoTrendColor);
}
/*
In Output.Line Method, just do:
DownLine[index] = TrendBuffer[extremumIndex+1];
UpLine[index] = double.NaN;
*/
}
trendStartIndex = index + 1;
TrendBuffer[extremumIndex+1] = Bars.OpenPrices[index + 1];
}
}
// ========= ========== ==========
bool DirectionChanged(int index)
{
// Dynamic Current Bar
bool dynCurrentUpDw = Bars.ClosePrices[index] > Bars.OpenPrices[index];
// I didn't put a dynamic bool because it can confuse
bool prevIsUp = Bars.ClosePrices[index - 1] > Bars.OpenPrices[index - 1];
bool nextIsUp = Bars.ClosePrices[index + 1] > Bars.OpenPrices[index + 1];
bool prevIsDown = Bars.ClosePrices[index - 1] < Bars.OpenPrices[index - 1];
bool nextIsDown = Bars.ClosePrices[index + 1] < Bars.OpenPrices[index + 1];
bool dynDirectionChanged = prevIsUp && dynCurrentUpDw && nextIsDown || prevIsDown && dynCurrentUpDw && nextIsDown
|| prevIsDown && !dynCurrentUpDw && nextIsUp || prevIsUp && !dynCurrentUpDw && nextIsUp;
return dynDirectionChanged;
}
}
/*
The comments from here will be shortened,
because there is a lot of REPETITION of STRUCTURE,
so when you understand a part, all are understood
*/
private void CalculateWaves(int direction, int firstCandle, int lastCandle, ShowWavesData WaveOption, int objectIndex, bool DirectionChanged = false)
{
// direction == 1 is Up, direction == 3 is Down
if (VolumeRR[lastCandle] == 0)
return;
if (WaveOption == ShowWavesData.No)
{
bool prevIsDown = Bars.ClosePrices[lastCandle - 1] < Bars.OpenPrices[lastCandle - 1];
bool nextIsDown = Bars.ClosePrices[lastCandle + 1] < Bars.OpenPrices[lastCandle + 1];
bool prevIsUp = Bars.ClosePrices[lastCandle - 1] > Bars.OpenPrices[lastCandle - 1];
bool nextIsUp = Bars.ClosePrices[lastCandle + 1] > Bars.OpenPrices[lastCandle + 1];
if (RepaintInput == RepaintData.No)
{
// Making sure to draw only at the end of waves
bool dynEndWave = (!prevIsDown && !DirectionChanged && nextIsDown || prevIsDown && DirectionChanged && nextIsDown)
|| (!prevIsUp && !DirectionChanged && nextIsUp || prevIsUp && DirectionChanged && nextIsUp);
if (dynEndWave)
OthersWaves();
}
else
OthersWaves();
return;
}
else
{
if (direction == 1)
{
double cumlVolume = cumulVolume();
if (cumlVolume == 0)
return;
double cumlRenko = cumulRenko();
double cumlVolPrice = Math.Round(cumlVolume / cumlRenko, 1);
bool prevIsDown = Bars.ClosePrices[lastCandle - 1] < Bars.OpenPrices[lastCandle - 1];
bool nextIsDown = Bars.ClosePrices[lastCandle + 1] < Bars.OpenPrices[lastCandle + 1];
bool endWave = (!prevIsDown && !DirectionChanged && nextIsDown || prevIsDown && DirectionChanged && nextIsDown);
if (RepaintInput == RepaintData.No)
{
// Making sure to draw only at the end of waves
if (endWave)
{
EvsR_Analysis(cumlVolPrice, endWave, true);
WW_Analysis(cumlVolume, true);
}
}
else
{
EvsR_Analysis(cumlVolPrice, endWave, true);
WW_Analysis(cumlVolume, true);
}
// --- Set Previous Bullish Wave Accumulated ---
SetPrevWaves(cumlVolume, cumlVolPrice, prevIsDown, nextIsDown, true);
// Other Waves
if (RepaintInput == RepaintData.No)
{
// Making sure to draw only at the end of waves
if (endWave)
OthersWaves();
}
else
OthersWaves();
}
else if (direction == 3)
{
double cumlVolume = cumulVolume();
if (cumlVolume == 0)
return;
double cumlRenko = cumulRenko();
double cumlVolPrice = Math.Round(cumlVolume / cumlRenko, 1);
bool prevIsUp = Bars.ClosePrices[lastCandle - 1] > Bars.OpenPrices[lastCandle - 1];
bool nextIsUp = Bars.ClosePrices[lastCandle + 1] > Bars.OpenPrices[lastCandle + 1];
bool endWave = (!prevIsUp && !DirectionChanged && nextIsUp || prevIsUp && DirectionChanged && nextIsUp);
if (RepaintInput == RepaintData.No)
{
// Making sure to draw only at the end of waves
if (endWave)
{
EvsR_Analysis(cumlVolPrice, endWave, false);
WW_Analysis(cumlVolume, false);
}
}
else
{
EvsR_Analysis(cumlVolPrice, endWave, false);
WW_Analysis(cumlVolume, false);
}
// --- Set Previous Downish Wave Accumulated ---
SetPrevWaves(cumlVolume, cumlVolPrice, prevIsUp, nextIsUp, false);
// Others Waves
if (RepaintInput == RepaintData.No)
{
// Making sure to draw only at the end of waves
if (endWave)
OthersWaves();
}
else
OthersWaves();
}
}
// ========= ========== ==========
void OthersWaves()
{
if (ShowOtherWaves_Input == ShowOtherWaves_Data.No)
return;
else if (ShowOtherWaves_Input == ShowOtherWaves_Data.Both)
{
if (direction == 1)
{
double Volume = cumulVolume();
if (Volume == 0)
return;
double dynPrice = cumulPrice(true);
double cumlTime = cumulTime();
if (cumlTime == 0 || cumlTime.ToString() == "NaN")
return;
string[] interval_tlapse = DynTimeLapse(cumlTime);
PriceTimeWave(dynPrice, interval_tlapse, true);
}
else if (direction == 3)
{
double Volume = cumulVolume();
if (Volume == 0)
return;
double dynPrice = cumulPrice(false);
double cumlTime = cumulTime();
if (cumlTime == 0 || cumlTime.ToString() == "NaN")
return;
string[] interval_tlapse = DynTimeLapse(cumlTime);
PriceTimeWave(dynPrice, interval_tlapse, false);
}
void PriceTimeWave(double dynPrice, string[] interval_tlapse, bool isUp)
{
if (isUp)
{
var selectedWave = ShowWavesInput;
string defaultStr = $"{Convert.ToDouble(interval_tlapse[0])}{interval_tlapse[1]}";
string dynStr;
if (NumbersPositionInput == NumbersPositionData.Outside)
dynStr = selectedWave == ShowWavesData.No ? $"{defaultStr} ⎪ {dynPrice}p\n\n" : selectedWave == ShowWavesData.Both ? $"{defaultStr} ⎪ {dynPrice}p\n\n\n\n" : $"{defaultStr} ⎪ {dynPrice}p\n\n\n";
else
dynStr = selectedWave == ShowWavesData.No ? $"{defaultStr} ⎪ {dynPrice}p" : selectedWave == ShowWavesData.Both ? $"{defaultStr} ⎪ {dynPrice}p\n\n\n" : $"{defaultStr} ⎪ {dynPrice}p\n\n";
ChartText dynText = Chart.DrawText($"PriceWave_{objectIndex}", dynStr, Bars.OpenTimes[lastCandle], Bars.ClosePrices[lastCandle], UpWaveColor);
dynText.VerticalAlignment = VerticalAlignment.Top;
dynText.HorizontalAlignment = HorizontalAlignment.Center;
}
else
{
var selectedWave = ShowWavesInput;
string defaultStr = $"{Convert.ToDouble(interval_tlapse[0])}{interval_tlapse[1]}";
string dynStr;
if (NumbersPositionInput == NumbersPositionData.Outside)
dynStr = selectedWave == ShowWavesData.No ? $"\n{defaultStr} ⎪ {dynPrice}p" : selectedWave == ShowWavesData.Both ? $"\n\n\n{defaultStr} ⎪ {dynPrice}p" : $"\n\n{defaultStr} ⎪ {dynPrice}p";
else
dynStr = selectedWave == ShowWavesData.No ? $"{defaultStr} ⎪ {dynPrice}p" : selectedWave == ShowWavesData.Both ? $"\n\n{defaultStr} ⎪ {dynPrice}p" : $"\n{defaultStr} ⎪ {dynPrice}p";
ChartText dynText = Chart.DrawText($"PriceWave_{objectIndex}", dynStr, Bars.OpenTimes[lastCandle], Bars.ClosePrices[lastCandle], DownWaveColor);
dynText.HorizontalAlignment = HorizontalAlignment.Center;
}
}
}
else if (ShowOtherWaves_Input == ShowOtherWaves_Data.Price)
{
if (direction == 1)
{
double Volume = cumulVolume();
if (Volume == 0)
return;
double dynPrice = cumulPrice(true);
PriceWave(dynPrice, true);
}
else if (direction == 3)
{
double Volume = cumulVolume();
if (Volume == 0)
return;
double dynPrice = cumulPrice(false);
PriceWave(dynPrice, false);
}
void PriceWave(double dynPrice, bool isUp)
{
if (isUp)
{
var selectedWave = ShowWavesInput;
string dynStr;
if (NumbersPositionInput == NumbersPositionData.Outside)
dynStr = selectedWave == ShowWavesData.No ? $"{dynPrice}p\n\n" : selectedWave == ShowWavesData.Both ? $"{dynPrice}p\n\n\n\n" : $"{dynPrice}p\n\n\n";
else
dynStr = selectedWave == ShowWavesData.No ? $"{dynPrice}p" : selectedWave == ShowWavesData.Both ? $"{dynPrice}p\n\n\n" : $"{dynPrice}p\n\n";
ChartText dynText = Chart.DrawText($"PriceWave_{objectIndex}", dynStr, Bars.OpenTimes[lastCandle], Bars.ClosePrices[lastCandle], UpWaveColor);
dynText.VerticalAlignment = VerticalAlignment.Top;
dynText.HorizontalAlignment = HorizontalAlignment.Center;
}
else
{
var selectedWave = ShowWavesInput;
string dynStr;
if (NumbersPositionInput == NumbersPositionData.Outside)
dynStr = selectedWave == ShowWavesData.No ? $"\n{dynPrice}p" : selectedWave == ShowWavesData.Both ? $"\n\n\n{dynPrice}p" : $"\n\n{dynPrice}p";
else
dynStr = selectedWave == ShowWavesData.No ? $"{dynPrice}p" : selectedWave == ShowWavesData.Both ? $"\n\n{dynPrice}p" : $"\n{dynPrice}p";
ChartText dynText = Chart.DrawText($"PriceWave_{objectIndex}", dynStr, Bars.OpenTimes[lastCandle], Bars.ClosePrices[lastCandle], DownWaveColor);
dynText.HorizontalAlignment = HorizontalAlignment.Center;
}
}
}
else if (ShowOtherWaves_Input == ShowOtherWaves_Data.Time)
{
if (direction == 1)
{
double Volume = cumulVolume();
if (Volume == 0)
return;
double cumlTime = cumulTime();
if (cumlTime == 0 || cumlTime.ToString() == "NaN")
return;
string[] interval_tlapse = DynTimeLapse(cumlTime);
TimeWave(interval_tlapse, true);
srlcarlg
Joined on 25.07.2022
- Distribution: Free
- Language: C#
- Trading platform: cTrader Automate
- File name: Weis & Wyckoff System v2.0.algo
- Rating: 5
- Installs: 117
- Modified: 13/12/2024 00:46

Comments
I download and install but in platform is not accessible or has invalid data format… I have clean installation from website cTrader..where could the problem be?
Hello srlcarlg
Wondering... would be willing to convert your updated code for this indicator to Sierra Chart - C++ for a reasonable fee? Thanks. Patrick
HI, and what is the strategy? is there a video for buy and sell entries and exits?
TraderExperto version of WWV is Good. don't know if volume calculation follow your volume for renko/range indicator logic or not. In Tradingview large volume effect can be measured in WWV wave.
Please ignore WWV that I mentioned before I think that one isn't accurate,
This one WWV uses renko size.
Look at this one Weis Wave Volume, David Weis uses this on tick chart. its good to have for renko as well.
Thanks
I strongly advise you to try the latest version of cTrader by spotware; I use it every day and the issues mentioned by people on the Telegram Group have not occurred to me thus far; and you can keep both versions of cTrader, the one provided by the broker and the latest version; at least, that's what I do. color tunnel
Hello @redart
I removed the code that generated the above mentioned error from all my indicators.
Download the updated .algo again and it should work.
I strongly recommend you to try the latest version of cTrader by Spotware, I use it every day and the issues listed by people on Telegram Group do not occur to me so far,
and you can keep both versions of cTrader, both the one provided by the broker and the latest version, at least that's what I do.
=====================================
Hello mztd006
I like Renko and Heiken-ash, but it seems like a swing strategy to me, and I only trade with Price&Volume methods, so I don't think this is promising enough to bring it to cTrader.
wow you nailed it !
far better than tradingview version ????
really appreciate time and effort you put in this code
since you show interest in renko look at this method too ! 4X-DAT
i back/forward test his method and it was very good only problem is it's to hard to do it manually(need alarm and some kind of dashboard)
Hello @redart
To try to reproduce your error, I installed all my indicators by downloading directly from the site in cTrader provided by IC Markets (cTrader v4.2.20) and I did not receive this message, the same with the latest version (cTrader v4.3.9) by Spotware , which was used for development.
Looks like:
1) Maybe you are using some old version of cTrader (like 4.1)
2) Your cTrader installation is fragmented (due to updates) and is giving file conflicts.
3) Your system's .NET framework is out of date.
Possible solution:
1) Try a Clean Installation and use the Cross-Broker cTrader provided by Spotware (v4.3.9 currently)
The first and only option solves all 3 situations I listed above
Thanks for the kind words, and let me know if your issue is resolved.
Hi,
Do you have a telegram contact?
I whould like to ask for some advice about an indicator