Description
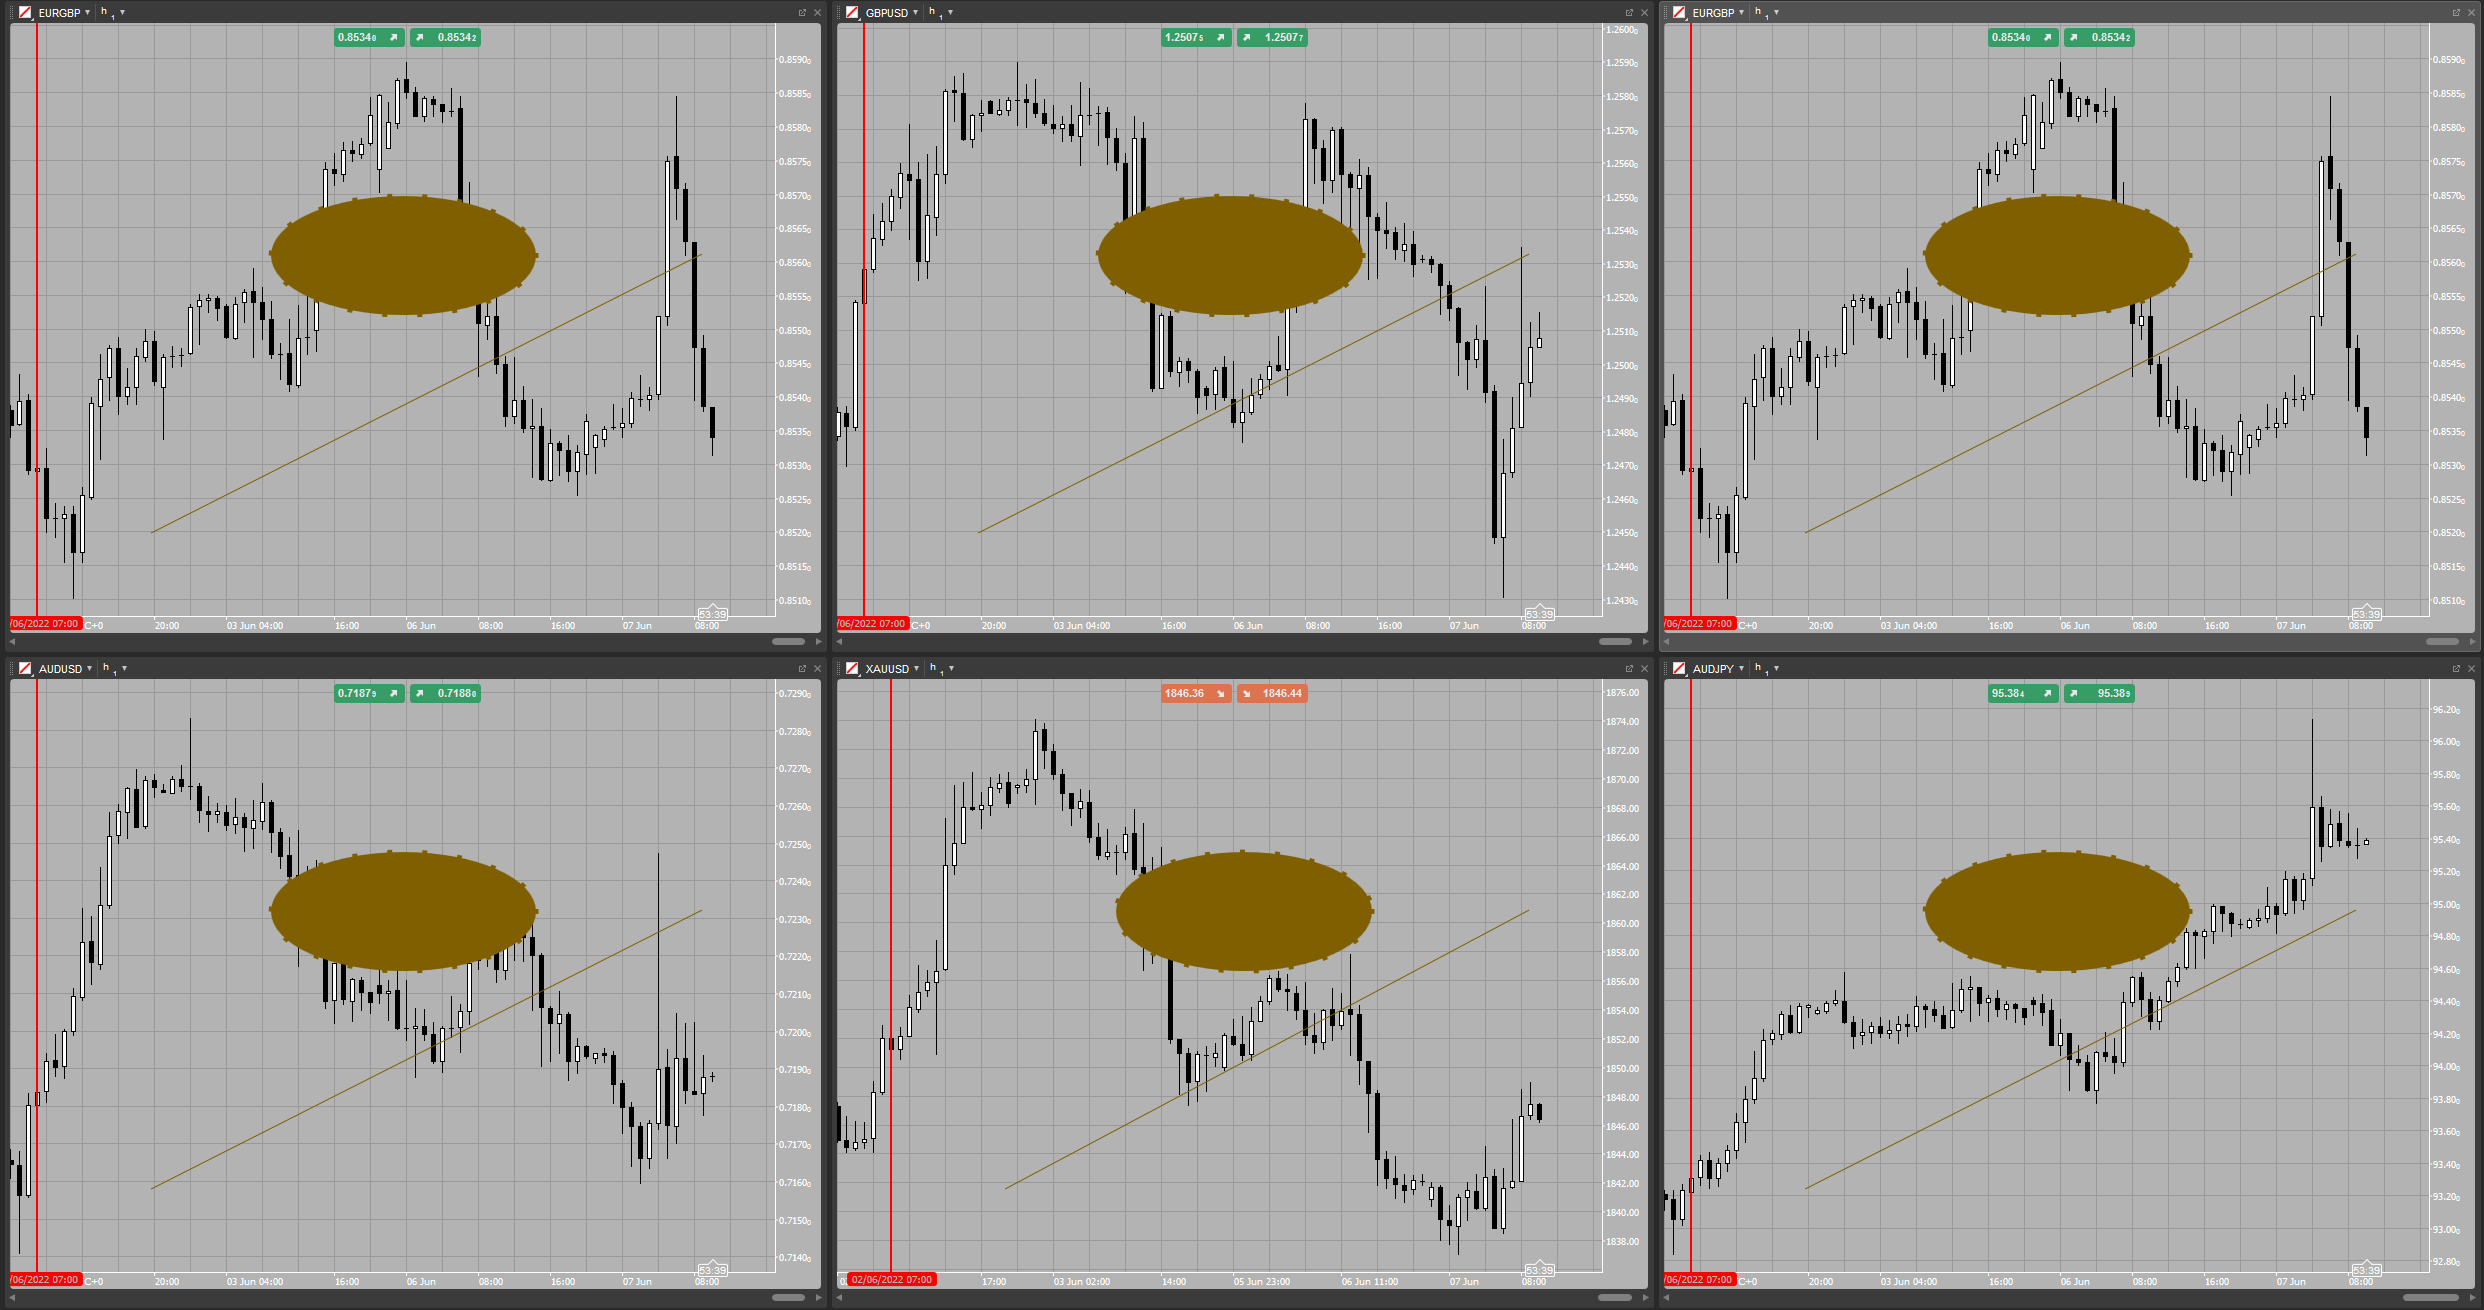
This indicator allows you to synchronize your chart drawings, it will sync your chart drawing in real time across all attached charts.
Features
- Updates, removes, and adds all cTrader chart drawings
- No user interaction needed
- Easy to use
- Different working modes that allows you to limit the indicator based on symbol or time frame
- Automatically adjusts the Y axis of drawings for different symbols relative to that symbol scale
This indicator is open source, feel free to fork and improve it on Github: spotware/Synchronized-Drawings: This is a cTrader indicator that allows you to synchronize your chart drawings (github.com)
using cAlgo.API;
using cAlgo.ChartObjectModels;
using System;
using System.Collections.Concurrent;
using System.Collections.Generic;
using System.Linq;
using System.Threading;
namespace cAlgo
{
[Indicator(IsOverlay = true, TimeZone = TimeZones.UTC, AccessRights = AccessRights.None)]
public class SynchronizedDrawings : Indicator
{
private static readonly ConcurrentDictionary<string, IndicatorInstanceContainer<SynchronizedDrawings>> _indicatorInstances = new ConcurrentDictionary<string, IndicatorInstanceContainer<SynchronizedDrawings>>();
private string _chartKey;
private DateTime _lastChartObjectsUpdateTime;
[Parameter("Mode", DefaultValue = Mode.All, Group = "General")]
public Mode Mode { get; set; }
[Parameter("Y Axis Type", DefaultValue = YAxisType.Relative, Group = "General")]
public YAxisType YAxisType { get; set; }
[Parameter("Object Type", DefaultValue = ObjectType.Interactive, Group = "General")]
public ObjectType ObjectType { get; set; }
public int IsInSync;
protected override void Initialize()
{
var chartObjectNamePrefix = string.Format("SynchronizedDrawings_{0}_{1}_{2}", SymbolName, TimeFrame, Chart.ChartType);
_chartKey = string.Format("{0}_{1}", chartObjectNamePrefix, Server.Time.Ticks);
foreach (var chartObject in Chart.Objects)
{
if (chartObject.Name.StartsWith(chartObjectNamePrefix, StringComparison.Ordinal))
{
Chart.RemoveObject(chartObject.Name);
}
}
_indicatorInstances.AddOrUpdate(_chartKey, new IndicatorInstanceContainer<SynchronizedDrawings>(this), (key, value) => new IndicatorInstanceContainer<SynchronizedDrawings>(this));
Chart.ObjectsAdded += Chart_ObjectsAdded;
Chart.ObjectsRemoved += Chart_ObjectsRemoved;
Chart.ObjectsUpdated += Chart_ObjectsUpdated;
}
private void Chart_ObjectsUpdated(ChartObjectsUpdatedEventArgs obj)
{
if (IsInSync > 0 || Server.TimeInUtc - _lastChartObjectsUpdateTime < TimeSpan.FromMilliseconds(100)) return;
_lastChartObjectsUpdateTime = Server.TimeInUtc;
var objects = obj.ChartObjects.Where(chartObject => IsObjectValid(chartObject)).ToArray();
if (objects.Length > 0)
{
SyncObjects(objects, ChartObjectOperationType.Updated);
}
}
private void Chart_ObjectsRemoved(ChartObjectsRemovedEventArgs obj)
{
if (IsInSync > 0) return;
var objects = obj.ChartObjects.Where(chartObject => IsObjectValid(chartObject)).ToArray();
if (objects.Length > 0)
{
SyncObjects(objects, ChartObjectOperationType.Removed);
}
}
private void Chart_ObjectsAdded(ChartObjectsAddedEventArgs obj)
{
if (IsInSync > 0) return;
var objects = obj.ChartObjects.Where(chartObject => IsObjectValid(chartObject)).ToArray();
if (objects.Length > 0)
{
SyncObjects(objects, ChartObjectOperationType.Added);
}
}
private bool IsObjectValid(ChartObject chartObject)
{
if (chartObject.ObjectType == ChartObjectType.Drawing) return false;
switch (ObjectType)
{
case ObjectType.Interactive:
return chartObject.IsInteractive;
case ObjectType.NonInteractive:
return !chartObject.IsInteractive;
default:
return true;
}
}
private void SyncObjects(ChartObject[] chartObjects, ChartObjectOperationType operationType)
{
var chartObjectModels = new List<IChartObjectModel>(chartObjects.Length);
foreach (var chartObject in chartObjects)
{
var model = chartObject.GetObjectModel(-1);
if (string.IsNullOrWhiteSpace(model.Name))
{
model.Name = string.Format("{0}_{1}", chartObject.GetHashCode(), _chartKey);
}
chartObjectModels.Add(model);
}
var indicators = GetIndicators();
var chartInfo = new ChartInfo
{
TopY = Chart.TopY,
BottomY = Chart.BottomY,
SymbolName = Chart.SymbolName
};
foreach (var indicatorKeyValuePair in indicators)
{
try
{
var chartObjectModelsCopy = chartObjectModels.ToArray();
Interlocked.Exchange(ref indicatorKeyValuePair.Value.IsInSync, 1);
indicatorKeyValuePair.Value.BeginInvokeOnMainThread(() => indicatorKeyValuePair.Value.UpdateObjects(chartObjectModelsCopy, operationType, chartInfo));
}
catch (Exception)
{
IndicatorInstanceContainer<SynchronizedDrawings> instanceContainer;
_indicatorInstances.TryRemove(indicatorKeyValuePair.Key, out instanceContainer);
}
}
}
public void UpdateObjects(IChartObjectModel[] chartObjectModels, ChartObjectOperationType operationType, ChartInfo sourceChartInfo)
{
try
{
var currentChartObjects = Chart.Objects.ToArray();
foreach (var chartObjectModel in chartObjectModels)
{
var currentObject = currentChartObjects.FirstOrDefault(chartObject => chartObject.Name.Equals(chartObjectModel.Name, StringComparison.Ordinal));
switch (operationType)
{
case ChartObjectOperationType.Added:
if (currentObject != null)
{
UpdateObject(chartObjectModel, currentObject, sourceChartInfo);
}
else
{
AddObject(chartObjectModel, sourceChartInfo);
}
break;
case ChartObjectOperationType.Removed:
if (currentObject != null)
{
Chart.RemoveObject(currentObject.Name);
}
break;
case ChartObjectOperationType.Updated:
if (currentObject != null)
{
UpdateObject(chartObjectModel, currentObject, sourceChartInfo);
}
else
{
AddObject(chartObjectModel, sourceChartInfo);
}
break;
}
}
}
finally
{
Interlocked.Exchange(ref IsInSync, 0);
}
}
private void AddObject(IChartObjectModel chartObjectModel, ChartInfo sourceChartInfo)
{
ChartObject result = null;
switch (chartObjectModel.ObjectType)
{
case ChartObjectType.AndrewsPitchfork:
var andrewsPitchfork = chartObjectModel as ChartAndrewsPitchforkModel;
result = Chart.DrawAndrewsPitchfork(chartObjectModel.Name, andrewsPitchfork.Time1, GetY(andrewsPitchfork.Y1, sourceChartInfo), andrewsPitchfork.Time2, GetY(andrewsPitchfork.Y2, sourceChartInfo),
andrewsPitchfork.Time3, GetY(andrewsPitchfork.Y3, sourceChartInfo), andrewsPitchfork.Color, andrewsPitchfork.Thickness, andrewsPitchfork.LineStyle);
break;
case ChartObjectType.Ellipse:
var ellipse = chartObjectModel as ChartEllipseModel;
result = Chart.DrawEllipse(chartObjectModel.Name, ellipse.Time1, GetY(ellipse.Y1, sourceChartInfo), ellipse.Time2, GetY(ellipse.Y2, sourceChartInfo), ellipse.Color);
break;
case ChartObjectType.EquidistantChannel:
var equidistantChannel = chartObjectModel as ChartEquidistantChannelModel;
var currentEquidistantChannel = Chart.DrawEquidistantChannel(chartObjectModel.Name, equidistantChannel.Time1, GetY(equidistantChannel.Y1, sourceChartInfo), equidistantChannel.Time2, GetY(equidistantChannel.Y2, sourceChartInfo),
GetYInTicks(equidistantChannel.ChannelHeight, sourceChartInfo), equidistantChannel.Color);
currentEquidistantChannel.ShowAngle = equidistantChannel.ShowAngle;
currentEquidistantChannel.ExtendToInfinity = equidistantChannel.ExtendToInfinity;
result = currentEquidistantChannel;
break;
case ChartObjectType.FibonacciExpansion:
var fibonacciExpansion = chartObjectModel as ChartFibonacciExpansionModel;
result = Chart.DrawFibonacciExpansion(chartObjectModel.Name, fibonacciExpansion.Time1, GetY(fibonacciExpansion.Y1, sourceChartInfo), fibonacciExpansion.Time2, GetY(fibonacciExpansion.Y2, sourceChartInfo),
fibonacciExpansion.Time3, GetY(fibonacciExpansion.Y3, sourceChartInfo), fibonacciExpansion.Color);
break;
case ChartObjectType.FibonacciFan:
var fibonacciFan = chartObjectModel as ChartFibonacciFanModel;
result = Chart.DrawFibonacciFan(chartObjectModel.Name, fibonacciFan.Time1, GetY(fibonacciFan.Y1, sourceChartInfo), fibonacciFan.Time2, GetY(fibonacciFan.Y2, sourceChartInfo), fibonacciFan.Color);
break;
case ChartObjectType.FibonacciRetracement:
var fibonacciRetracement = chartObjectModel as ChartFibonacciRetracementModel;
result = Chart.DrawFibonacciRetracement(chartObjectModel.Name, fibonacciRetracement.Time1, GetY(fibonacciRetracement.Y1, sourceChartInfo), fibonacciRetracement.Time2, GetY(fibonacciRetracement.Y2, sourceChartInfo),
fibonacciRetracement.Color);
break;
case ChartObjectType.HorizontalLine:
var horizontalLine = chartObjectModel as ChartHorizontalLineModel;
result = Chart.DrawHorizontalLine(chartObjectModel.Name, GetY(horizontalLine.Y, sourceChartInfo), horizontalLine.Color, horizontalLine.Thickness, horizontalLine.LineStyle);
break;
case ChartObjectType.Icon:
var icon = chartObjectModel as ChartIconModel;
result = Chart.DrawIcon(chartObjectModel.Name, icon.IconType, icon.Time, GetY(icon.Y, sourceChartInfo), icon.Color);
break;
case ChartObjectType.Rectangle:
var rectangle = chartObjectModel as ChartRectangleModel;
result = Chart.DrawRectangle(chartObjectModel.Name, rectangle.Time1, GetY(rectangle.Y1, sourceChartInfo), rectangle.Time2, GetY(rectangle.Y2, sourceChartInfo), rectangle.Color);
break;
case ChartObjectType.StaticText:
var staticText = chartObjectModel as ChartStaticTextModel;
result = Chart.DrawStaticText(chartObjectModel.Name, staticText.Text, staticText.VerticalAlignment, staticText.HorizontalAlignment, staticText.Color);
break;
case ChartObjectType.Text:
var text = chartObjectModel as ChartTextModel;
var currentChartText = Chart.DrawText(chartObjectModel.Name, text.Text, text.Time, GetY(text.Y, sourceChartInfo), text.Color);
currentChartText.FontSize = text.FontSize;
currentChartText.IsBold = text.IsBold;
currentChartText.IsItalic = text.IsItalic;
currentChartText.IsUnderlined = text.IsUnderlined;
result = currentChartText;
break;
case ChartObjectType.TrendLine:
var trendLine = chartObjectModel as ChartTrendLineModel;
var currentChartTrendLine = Chart.DrawTrendLine(chartObjectModel.Name, trendLine.Time1, GetY(trendLine.Y1, sourceChartInfo), trendLine.Time2, GetY(trendLine.Y2, sourceChartInfo), trendLine.Color, trendLine.Thickness, trendLine.LineStyle);
currentChartTrendLine.ExtendToInfinity = trendLine.ExtendToInfinity;
currentChartTrendLine.ShowAngle = trendLine.ShowAngle;
result = currentChartTrendLine;
break;
case ChartObjectType.Triangle:
var triangle = chartObjectModel as ChartTriangleModel;
result = Chart.DrawTriangle(chartObjectModel.Name, triangle.Time1, GetY(triangle.Y1, sourceChartInfo), triangle.Time2, GetY(triangle.Y2, sourceChartInfo), triangle.Time3, GetY(triangle.Y3, sourceChartInfo), triangle.Color);
break;
case ChartObjectType.VerticalLine:
var verticalLine = chartObjectModel as ChartVerticalLineModel;
result = Chart.DrawVerticalLine(chartObjectModel.Name, verticalLine.Time, verticalLine.Color, verticalLine.Thickness, verticalLine.LineStyle);
break;
}
result.Comment = chartObjectModel.Comment;
result.IsLocked = chartObjectModel.IsLocked;
result.IsHidden = chartObjectModel.IsHidden;
if (chartObjectModel.ObjectType != ChartObjectType.StaticText)
{
result.IsInteractive = chartObjectModel.IsInteractive;
}
if (result is ChartShape)
{
var chartObjectShape = chartObjectModel as ChartShapeModel;
var resultShape = result as ChartShape;
resultShape.LineStyle = chartObjectShape.LineStyle;
resultShape.Thickness = chartObjectShape.Thickness;
resultShape.IsFilled = chartObjectShape.IsFilled;
}
if (result is ChartFibonacciBase)
{
var chartObjectFibonacciBase = chartObjectModel as ChartFibonacciBaseModel;
var resultFibonacciBase = result as ChartFibonacciBase;
resultFibonacciBase.DisplayPrices = chartObjectFibonacciBase.DisplayPrices;
}
}
private void UpdateObject(IChartObjectModel chartObjectModel, ChartObject currentChartObject, ChartInfo sourceChartInfo)
{
switch (chartObjectModel.ObjectType)
{
case ChartObjectType.AndrewsPitchfork:
var otherChartAndrewsPitchfork = chartObjectModel as ChartAndrewsPitchforkModel;
var currentChartAndrewsPitchfork = currentChartObject as ChartAndrewsPitchfork;
currentChartAndrewsPitchfork.Time1 = otherChartAndrewsPitchfork.Time1;
currentChartAndrewsPitchfork.Time2 = otherChartAndrewsPitchfork.Time2;
currentChartAndrewsPitchfork.Time3 = otherChartAndrewsPitchfork.Time3;
currentChartAndrewsPitchfork.Y1 = GetY(otherChartAndrewsPitchfork.Y1, sourceChartInfo);
currentChartAndrewsPitchfork.Y2 = GetY(otherChartAndrewsPitchfork.Y2, sourceChartInfo);
currentChartAndrewsPitchfork.Y3 = GetY(otherChartAndrewsPitchfork.Y3, sourceChartInfo);
currentChartAndrewsPitchfork.Color = otherChartAndrewsPitchfork.Color;
currentChartAndrewsPitchfork.LineStyle = otherChartAndrewsPitchfork.LineStyle;
currentChartAndrewsPitchfork.Thickness = otherChartAndrewsPitchfork.Thickness;
break;
case ChartObjectType.Ellipse:
var otherChartEllipse = chartObjectModel as ChartEllipseModel;
var currentChartEllipse = currentChartObject as ChartEllipse;
currentChartEllipse.Time1 = otherChartEllipse.Time1;
currentChartEllipse.Time2 = otherChartEllipse.Time2;
currentChartEllipse.Y1 = GetY(otherChartEllipse.Y1, sourceChartInfo);
currentChartEllipse.Y2 = GetY(otherChartEllipse.Y2, sourceChartInfo);
currentChartEllipse.Color = otherChartEllipse.Color;
break;
case ChartObjectType.EquidistantChannel:
var otherChartEquidistantChanne = chartObjectModel as ChartEquidistantChannelModel;
var currentChartEquidistantChanne = currentChartObject as ChartEquidistantChannel;
currentChartEquidistantChanne.Time1 = otherChartEquidistantChanne.Time1;
currentChartEquidistantChanne.Time2 = otherChartEquidistantChanne.Time2;
currentChartEquidistantChanne.Y1 = GetY(otherChartEquidistantChanne.Y1, sourceChartInfo);
currentChartEquidistantChanne.Y2 = GetY(otherChartEquidistantChanne.Y2, sourceChartInfo);
currentChartEquidistantChanne.Color = otherChartEquidistantChanne.Color;
currentChartEquidistantChanne.ChannelHeight = GetYInTicks(otherChartEquidistantChanne.ChannelHeight, sourceChartInfo);
currentChartEquidistantChanne.ShowAngle = otherChartEquidistantChanne.ShowAngle;
currentChartEquidistantChanne.ExtendToInfinity = otherChartEquidistantChanne.ExtendToInfinity;
break;
case ChartObjectType.FibonacciExpansion:
var otherChartFibonacciExpansion = chartObjectModel as ChartFibonacciExpansionModel;
var currentChartFibonacciExpansion = currentChartObject as ChartFibonacciExpansion;
currentChartFibonacciExpansion.Time1 = otherChartFibonacciExpansion.Time1;
currentChartFibonacciExpansion.Time2 = otherChartFibonacciExpansion.Time2;
currentChartFibonacciExpansion.Time3 = otherChartFibonacciExpansion.Time3;
currentChartFibonacciExpansion.Y1 = GetY(otherChartFibonacciExpansion.Y1, sourceChartInfo);
currentChartFibonacciExpansion.Y2 = GetY(otherChartFibonacciExpansion.Y2, sourceChartInfo);
currentChartFibonacciExpansion.Y3 = GetY(otherChartFibonacciExpansion.Y3, sourceChartInfo);
currentChartFibonacciExpansion.Color = otherChartFibonacciExpansion.Color;
currentChartFibonacciExpansion.LineStyle = otherChartFibonacciExpansion.LineStyle;
currentChartFibonacciExpansion.Thickness = otherChartFibonacciExpansion.Thickness;
currentChartFibonacciExpansion.DisplayPrices = otherChartFibonacciExpansion.DisplayPrices;
break;
case ChartObjectType.FibonacciFan:
var otherChartFibonacciFan = chartObjectModel as ChartFibonacciFanModel;
var currentChartFibonacciFan = currentChartObject as ChartFibonacciFan;
currentChartFibonacciFan.Time1 = otherChartFibonacciFan.Time1;
currentChartFibonacciFan.Time2 = otherChartFibonacciFan.Time2;
currentChartFibonacciFan.Y1 = GetY(otherChartFibonacciFan.Y1, sourceChartInfo);
currentChartFibonacciFan.Y2 = GetY(otherChartFibonacciFan.Y2, sourceChartInfo);
currentChartFibonacciFan.Color = otherChartFibonacciFan.Color;
currentChartFibonacciFan.LineStyle = otherChartFibonacciFan.LineStyle;
currentChartFibonacciFan.Thickness = otherChartFibonacciFan.Thickness;
currentChartFibonacciFan.DisplayPrices = otherChartFibonacciFan.DisplayPrices;
break;
case ChartObjectType.FibonacciRetracement:
var otherChartFibonacciRetracement = chartObjectModel as ChartFibonacciRetracementModel;
var currentChartFibonacciRetracement = currentChartObject as ChartFibonacciRetracement;
currentChartFibonacciRetracement.Time1 = otherChartFibonacciRetracement.Time1;
currentChartFibonacciRetracement.Time2 = otherChartFibonacciRetracement.Time2;
currentChartFibonacciRetracement.Y1 = GetY(otherChartFibonacciRetracement.Y1, sourceChartInfo);
currentChartFibonacciRetracement.Y2 = GetY(otherChartFibonacciRetracement.Y2, sourceChartInfo);
currentChartFibonacciRetracement.Color = otherChartFibonacciRetracement.Color;
currentChartFibonacciRetracement.LineStyle = otherChartFibonacciRetracement.LineStyle;
currentChartFibonacciRetracement.Thickness = otherChartFibonacciRetracement.Thickness;
currentChartFibonacciRetracement.DisplayPrices = otherChartFibonacciRetracement.DisplayPrices;
break;
case ChartObjectType.HorizontalLine:
var otherChartHorizontalLine = chartObjectModel as ChartHorizontalLineModel;
var currentChartHorizontalLine = currentChartObject as ChartHorizontalLine;
currentChartHorizontalLine.Y = GetY(otherChartHorizontalLine.Y, sourceChartInfo);
currentChartHorizontalLine.Color = otherChartHorizontalLine.Color;
currentChartHorizontalLine.LineStyle = otherChartHorizontalLine.LineStyle;
currentChartHorizontalLine.Thickness = otherChartHorizontalLine.Thickness;
break;
case ChartObjectType.Icon:
var otherChartIcon = chartObjectModel as ChartIconModel;
var currentChartIcon = currentChartObject as ChartIcon;
currentChartIcon.IconType = otherChartIcon.IconType;
currentChartIcon.Time = otherChartIcon.Time;
currentChartIcon.Y = GetY(otherChartIcon.Y, sourceChartInfo);
currentChartIcon.Color = otherChartIcon.Color;
break;
case ChartObjectType.Rectangle:
var otherChartRectangle = chartObjectModel as ChartRectangleModel;
var currentChartRectangle = currentChartObject as ChartRectangle;
currentChartRectangle.Time1 = otherChartRectangle.Time1;
currentChartRectangle.Time2 = otherChartRectangle.Time2;
currentChartRectangle.Y1 = GetY(otherChartRectangle.Y1, sourceChartInfo);
currentChartRectangle.Y2 = GetY(otherChartRectangle.Y2, sourceChartInfo);
currentChartRectangle.Color = otherChartRectangle.Color;
currentChartRectangle.LineStyle = otherChartRectangle.LineStyle;
currentChartRectangle.Thickness = otherChartRectangle.Thickness;
break;
case ChartObjectType.StaticText:
var otherChartStaticText = chartObjectModel as ChartStaticTextModel;
var currentChartStaticText = currentChartObject as ChartStaticText;
currentChartStaticText.Text = otherChartStaticText.Text;
currentChartStaticText.VerticalAlignment = otherChartStaticText.VerticalAlignment;
currentChartStaticText.HorizontalAlignment = otherChartStaticText.HorizontalAlignment;
currentChartStaticText.Color = otherChartStaticText.Color;
break;
case ChartObjectType.Text:
var otherChartText = chartObjectModel as ChartTextModel;
var currentChartText = currentChartObject as ChartText;
currentChartText.Text = otherChartText.Text;
currentChartText.Time = otherChartText.Time;
currentChartText.Y = GetY(otherChartText.Y, sourceChartInfo);
currentChartText.Color = otherChartText.Color;
currentChartText.FontSize = otherChartText.FontSize;
currentChartText.IsBold = otherChartText.IsBold;
currentChartText.IsItalic = otherChartText.IsItalic;
currentChartText.IsUnderlined = otherChartText.IsUnderlined;
break;
case ChartObjectType.TrendLine:
var otherChartTrendLine = chartObjectModel as ChartTrendLineModel;
var currentChartTrendLine = currentChartObject as ChartTrendLine;
currentChartTrendLine.Time1 = otherChartTrendLine.Time1;
currentChartTrendLine.Time2 = otherChartTrendLine.Time2;
currentChartTrendLine.Y1 = GetY(otherChartTrendLine.Y1, sourceChartInfo);
currentChartTrendLine.Y2 = GetY(otherChartTrendLine.Y2, sourceChartInfo);
currentChartTrendLine.Color = otherChartTrendLine.Color;
currentChartTrendLine.ExtendToInfinity = otherChartTrendLine.ExtendToInfinity;
currentChartTrendLine.Thickness = otherChartTrendLine.Thickness;
currentChartTrendLine.LineStyle = otherChartTrendLine.LineStyle;
currentChartTrendLine.ShowAngle = otherChartTrendLine.ShowAngle;
break;
case ChartObjectType.Triangle:
var otherChartTriangle = chartObjectModel as ChartTriangleModel;
var currentChartTriangle = currentChartObject as ChartTriangle;
currentChartTriangle.Time1 = otherChartTriangle.Time1;
currentChartTriangle.Time2 = otherChartTriangle.Time2;
currentChartTriangle.Time3 = otherChartTriangle.Time3;
currentChartTriangle.Y1 = GetY(otherChartTriangle.Y1, sourceChartInfo);
currentChartTriangle.Y2 = GetY(otherChartTriangle.Y2, sourceChartInfo);
currentChartTriangle.Y3 = GetY(otherChartTriangle.Y3, sourceChartInfo);
currentChartTriangle.Color = otherChartTriangle.Color;
currentChartTriangle.LineStyle = otherChartTriangle.LineStyle;
currentChartTriangle.Thickness = otherChartTriangle.Thickness;
break;
case ChartObjectType.VerticalLine:
var otherChartVerticalLine = chartObjectModel as ChartVerticalLineModel;
var currentChartVerticalLine = currentChartObject as ChartVerticalLine;
currentChartVerticalLine.Time = otherChartVerticalLine.Time;
currentChartVerticalLine.Color = otherChartVerticalLine.Color;
currentChartVerticalLine.LineStyle = otherChartVerticalLine.LineStyle;
currentChartVerticalLine.Thickness = otherChartVerticalLine.Thickness;
break;
}
currentChartObject.Comment = chartObjectModel.Comment;
currentChartObject.IsLocked = chartObjectModel.IsLocked;
currentChartObject.IsHidden = chartObjectModel.IsHidden;
if (currentChartObject.ObjectType != ChartObjectType.StaticText)
{
currentChartObject.IsInteractive = chartObjectModel.IsInteractive;
}
if (currentChartObject is ChartShape)
{
var otherShape = chartObjectModel as ChartShapeModel;
var currentShape = currentChartObject as ChartShape;
currentShape.LineStyle = otherShape.LineStyle;
currentShape.Thickness = otherShape.Thickness;
currentShape.IsFilled = otherShape.IsFilled;
}
}
private double GetY(double absoluteY, ChartInfo sourceChartInfo)
{
if (YAxisType == YAxisType.Absolute || sourceChartInfo.SymbolName.Equals(SymbolName, StringComparison.Ordinal))
{
return absoluteY;
}
var topToBottomDiff = sourceChartInfo.TopY - sourceChartInfo.BottomY;
var diff = absoluteY - sourceChartInfo.BottomY;
var percent = diff / topToBottomDiff;
var chartTopToBottomDiff = Chart.TopY - Chart.BottomY;
return Chart.BottomY + (chartTopToBottomDiff * percent);
}
private double GetYInTicks(double absoluteY, ChartInfo sourceChartInfo)
{
if (YAxisType == YAxisType.Absolute || sourceChartInfo.SymbolName.Equals(SymbolName, StringComparison.Ordinal))
{
return absoluteY;
}
var topToBottomDiff = sourceChartInfo.TopY - sourceChartInfo.BottomY;
var percent = absoluteY / topToBottomDiff;
var chartTopToBottomDiff = Chart.TopY - Chart.BottomY;
return chartTopToBottomDiff * percent;
}
public override void Calculate(int index)
{
}
private List<KeyValuePair<string, SynchronizedDrawings>> GetIndicators()
{
Func<SynchronizedDrawings, bool> predicate;
switch (Mode)
{
case Mode.Symbol:
predicate = indicator => indicator.SymbolName.Equals(SymbolName, StringComparison.Ordinal);
break;
case Mode.TimeFrame:
predicate = indicator => indicator.TimeFrame == TimeFrame;
break;
default:
predicate = null;
break;
}
var result = new List<KeyValuePair<string, SynchronizedDrawings>>(_indicatorInstances.Values.Count);
foreach (var indicatorContianer in _indicatorInstances)
{
SynchronizedDrawings indicator;
if (indicatorContianer.Value.GetIndicator(out indicator) == false || indicator == this || (predicate != null && predicate(indicator) == false))
continue;
result.Add(new KeyValuePair<string, SynchronizedDrawings>(indicatorContianer.Key, indicator));
}
return result;
}
}
public enum Mode
{
All,
TimeFrame,
Symbol
}
public enum YAxisType
{
Absolute,
Relative,
}
public class IndicatorInstanceContainer<T> where T : Indicator
{
private readonly WeakReference _indicatorWeakReference;
public IndicatorInstanceContainer(T indicator)
{
_indicatorWeakReference = new WeakReference(indicator);
}
public bool GetIndicator(out T indicator)
{
if (_indicatorWeakReference.IsAlive)
{
indicator = (T)_indicatorWeakReference.Target;
return true;
}
indicator = null;
return false;
}
}
public enum ChartObjectOperationType
{
Updated,
Added,
Removed
}
public enum ObjectType
{
Interactive,
NonInteractive,
All
}
public class ChartInfo
{
public double TopY { get; set; }
public double BottomY { get; set; }
public string SymbolName { get; set; }
}
}
Spotware
Joined on 23.09.2013
- Distribution: Free
- Language: C#
- Trading platform: cTrader Automate
- File name: Synchronized Drawings.algo
- Rating: 5
- Installs: 2785
- Modified: 07/06/2022 10:11

Comments
Good tool, but it doesn't work properly with Fibonacci retracement: it does not keep the parameters when changing the time frame.
In the exemple below, i have created a Fibonacci retracement in T15 time frame with only 0%, 50% and 100%.
And in m8 time frame, it is horrible with far more percentage levels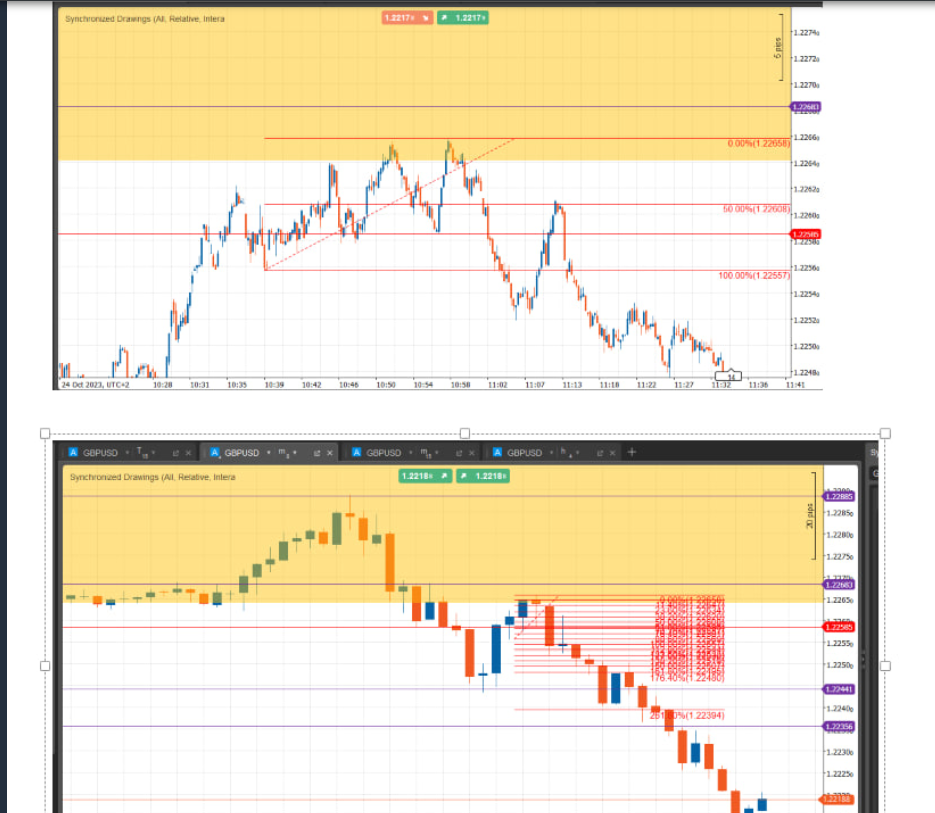
Guys all these "articles" are are spam and probably infected links for people that are curious to click on
Im surprised spotwave hasn't removed or made this forum more resilient to spam bots and scammers
as this sort of forum scammers have been doing this for years
@fcarabat hahaha.
I am equally confused.
Anyway, have you used this indicator? or found another solution for linking/syncing chart drawings?
Have you ever had the sensation of standing under a hole and knowing you have the ability to get up, but you don't want to do so. I had the time of my life. A gartic phone came in handy during that time. A failure to do so will leave me with no hope of recovery.
what article are you people referring to? this is an indicator. what's going on here? have you lost your minds?
Obrigado! Muito útil!