Description
This following trend indicator is very reliable. It guides traders in the market about the prevailing or beginning direction. Moreover, it's a non-repainting indicator.
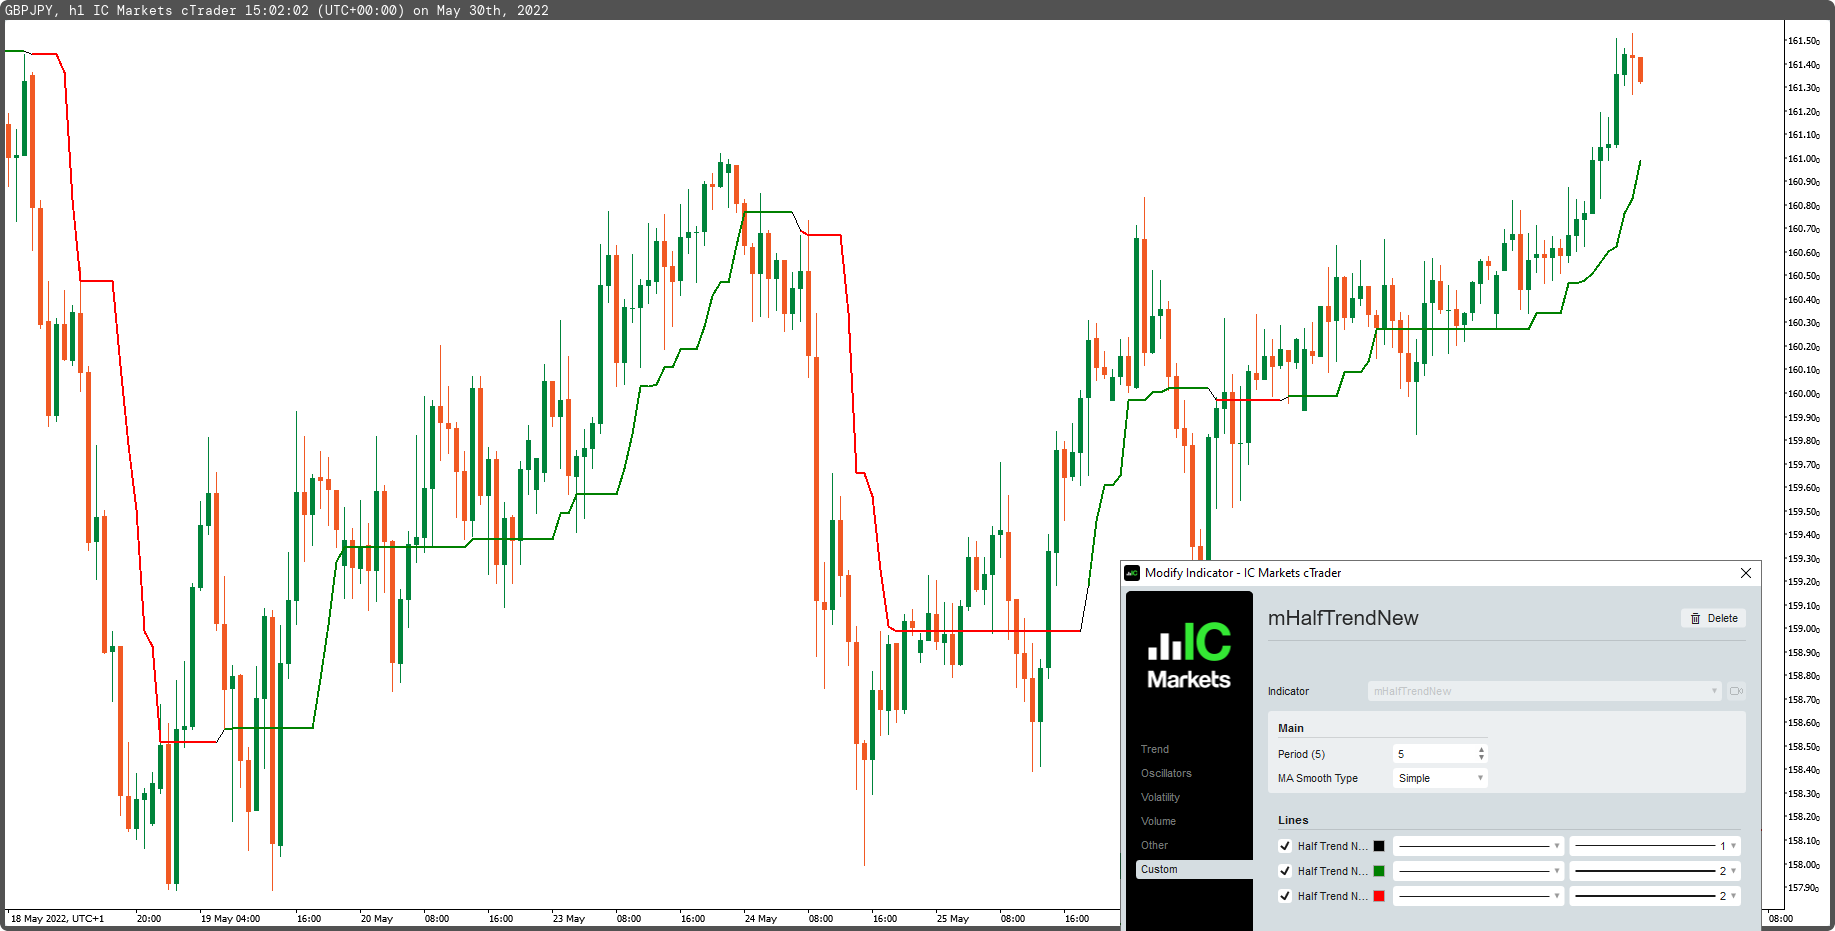
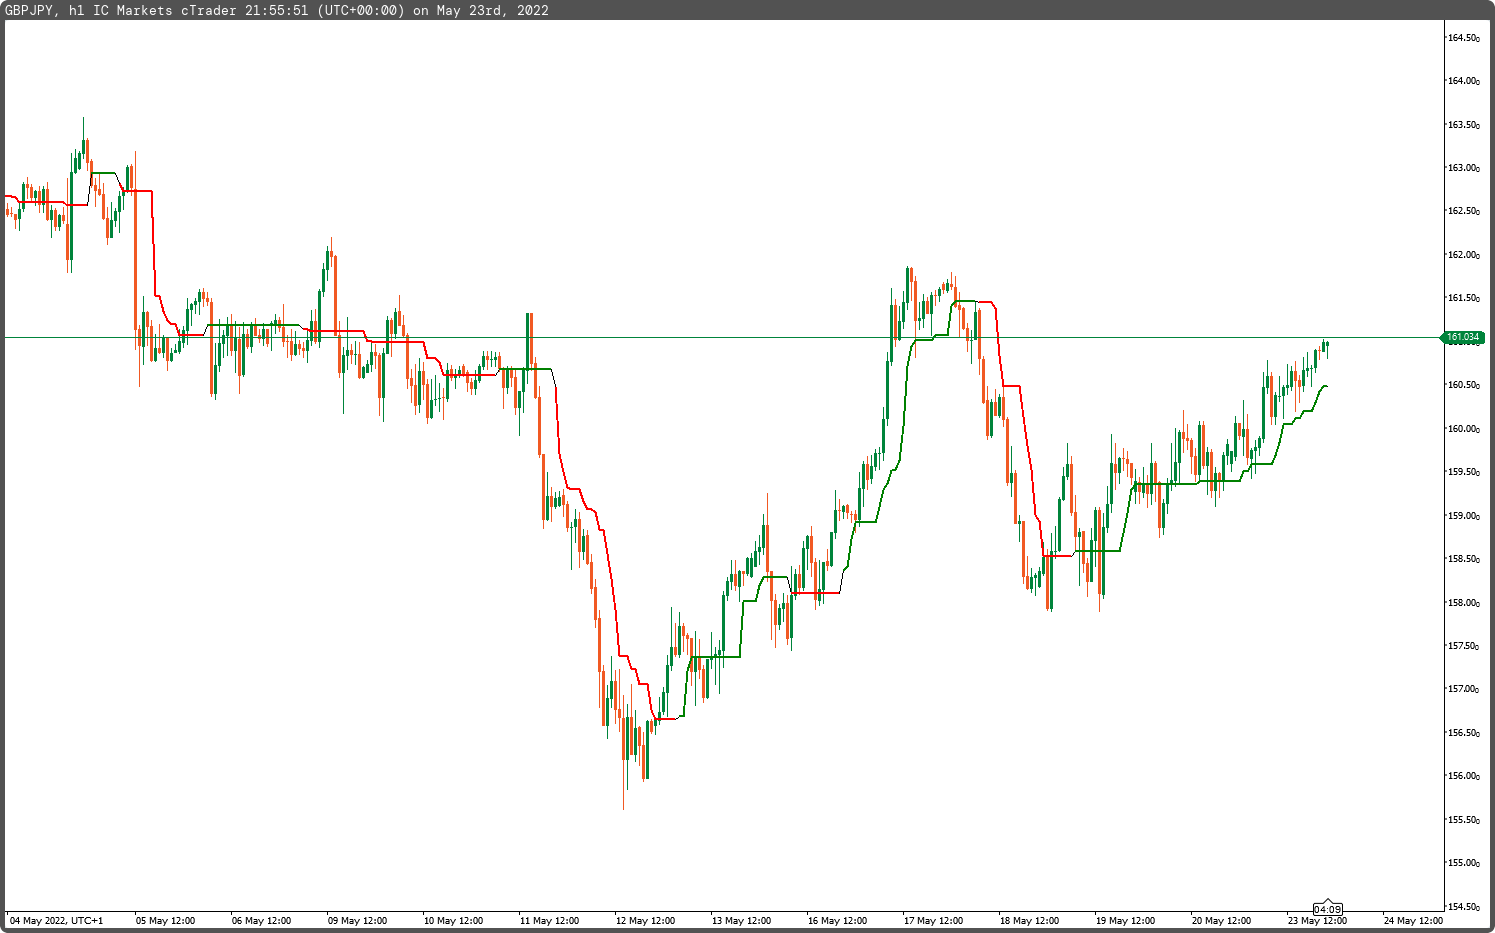
The HalfTrend indicator represents the trend indicator that draws zones based on moving average intersection. The indicator draws bearish and bullish invalidation zones on the chart and marks a trend shift. The Green line represents the “Long” zone, while the Red line “Short” zone.
The HalfTrend indicator shows also, the strength of the trend. If there is no trend, the indicator will be flat and we identify it as accumulation temporary price or distribution zones. However, if a trend exists, there will be a slope in that direction. If the slope is steep, the trend is strong. If there is a strong uptrend, the indicator will be green, and the slope will be upward and robust. If there is a downtrend, the indicator will be red with a downward slope.
On the other hand, this indicator follows difference of the real market value and the price. In some cases, price momentum is stretched in opposite of trade zone compared with price level of HalfTrend "level of change zone", when the supply and demand can be identified also.
https://chartshots.ctradercloud.com/628c02e7da7b4.png
using System;
using cAlgo.API;
using cAlgo.API.Internals;
using cAlgo.API.Indicators;
using cAlgo.Indicators;

namespace cAlgo
{
    [Indicator(IsOverlay = true, TimeZone = TimeZones.UTC, AccessRights = AccessRights.None)]
    public class mHalfTrendNew : Indicator
    {
        [Parameter("Period (5) ", DefaultValue = 5, Group = "Main")]
        public int inpAmplitude { get; set; }
        [Parameter("MA Smooth Type", DefaultValue = MovingAverageType.Simple, Group = "Main")]
        public MovingAverageType MaTypeSmooth { get; set; }


        [Output("Half Trend New", LineColor = "Black", PlotType = PlotType.Line, LineStyle = LineStyle.Solid, Thickness = 1)]
        public IndicatorDataSeries outHTn { get; set; }
        [Output("Half Trend New - Bullish", LineColor = "Green", PlotType = PlotType.DiscontinuousLine, LineStyle = LineStyle.Solid, Thickness = 2)]
        public IndicatorDataSeries outHTnBullish { get; set; }
        [Output("Half Trend New - Bearish", LineColor = "Red", PlotType = PlotType.DiscontinuousLine, LineStyle = LineStyle.Solid, Thickness = 2)]
        public IndicatorDataSeries outHTnBearish { get; set; }


        private MovingAverage _mah;
        private MovingAverage _mal;
        private IndicatorDataSeries _hh;
        private IndicatorDataSeries _ll;
        private IndicatorDataSeries _htn;
        private IndicatorDataSeries _htnbullish;
        private IndicatorDataSeries _htnbearish;


        protected override void Initialize()
        {
            _mah = Indicators.MovingAverage(Bars.HighPrices, inpAmplitude, MaTypeSmooth);
            _mal = Indicators.MovingAverage(Bars.LowPrices, inpAmplitude, MaTypeSmooth);
            _hh = CreateDataSeries();
            _ll = CreateDataSeries();
            _htn = CreateDataSeries();
            _htnbullish = CreateDataSeries();
            _htnbearish = CreateDataSeries();
        }

        public override void Calculate(int i)
        {
            if (i < inpAmplitude + 2)
            {
                _htn[i] = _htnbullish[i] = _htnbearish[i] = Bars.ClosePrices[i];
                outHTn[i] = _htn[i];
                outHTnBullish[i] = _htnbullish[i];
                outHTnBearish[i] = _htnbearish[i];
                return;
            }

            _hh[i] = Bars.HighPrices.Maximum(inpAmplitude - 1);
            _ll[i] = Bars.LowPrices.Minimum(inpAmplitude - 1);


            _htn[i] = _htn[i - 1];
            _htnbullish[i] = _htnbullish[i - 1];
            _htnbearish[i] = _htnbearish[i - 1];

            if (_mah.Result[i] < _htn[i - 1] && _mal.Result[i] < _htn[i - 1] && _hh[i - 1] < _htn[i - 1])
            {
                _htn[i] = _hh[i - 1];

            }
            if (_mah.Result[i] > _htn[i - 1] && _mal.Result[i] > _htn[i - 1] && _ll[i - 1] > _htn[i - 1])
            {
                _htn[i] = _ll[i - 1];

            }


            if (_htn[i] > _htn[i - 1])
            {
                _htnbullish[i] = _htn[i];
                _htnbearish[i] = double.NaN;
            }
            if (_htn[i] < _htn[i - 1])
            {
                _htnbullish[i] = double.NaN;
                _htnbearish[i] = _htn[i];
            }

            outHTn[i] = _htn[i];
            outHTnBullish[i] = _htnbullish[i];
            outHTnBearish[i] = _htnbearish[i];
        }
    }
}
mfejza
Joined on 25.01.2022
- Distribution: Free
- Language: C#
- Trading platform: cTrader Automate
- File name: mHalfTrendNew.algo
- Rating: 5
- Installs: 3591
- Modified: 23/05/2022 21:54

Comments
Fine Beach Article LETTES OUTRANGE Ä-14
JDS Outrange 35 % TX Husserl
RW 685 LOCK-WHITE :: OUTRANGE ELEVEN
Traders can rely on this indicator to tell them whether the market is trending up or down.
Changing the "MA Smooth Type" parameter makes no difference on the output. Are you sure it's coded correctly? Just call up any chart and change it from "Simple" to "weighted" to even "hull".
Nothing happens.